Turkey - Octanol (Octyl Alcohol) And Isomers Thereof - Market Analysis, Forecast, Size, Trends And Insights
Get instant access to more than 2 million reports, dashboards, and datasets on the IndexBox Platform.
View PricingDecrease in Turkey's Octyl Alcohol Imports to $196M by 2023
Turkey Octyl Alcohol Imports
In 2023, overseas purchases of octanol (octyl alcohol) and isomers thereof decreased by -16.3% to 156K tons for the first time since 2020, thus ending a two-year rising trend. In general, imports, however, recorded a strong expansion. The growth pace was the most rapid in 2021 when imports increased by 61% against the previous year. Imports peaked at 187K tons in 2022, and then fell notably in the following year.
In value terms, octyl alcohol imports declined remarkably to $196M (IndexBox estimates) in 2023. Over the period under review, imports, however, enjoyed measured growth. The most prominent rate of growth was recorded in 2021 when imports increased by 149%. Imports peaked at $335M in 2022, and then fell sharply in the following year.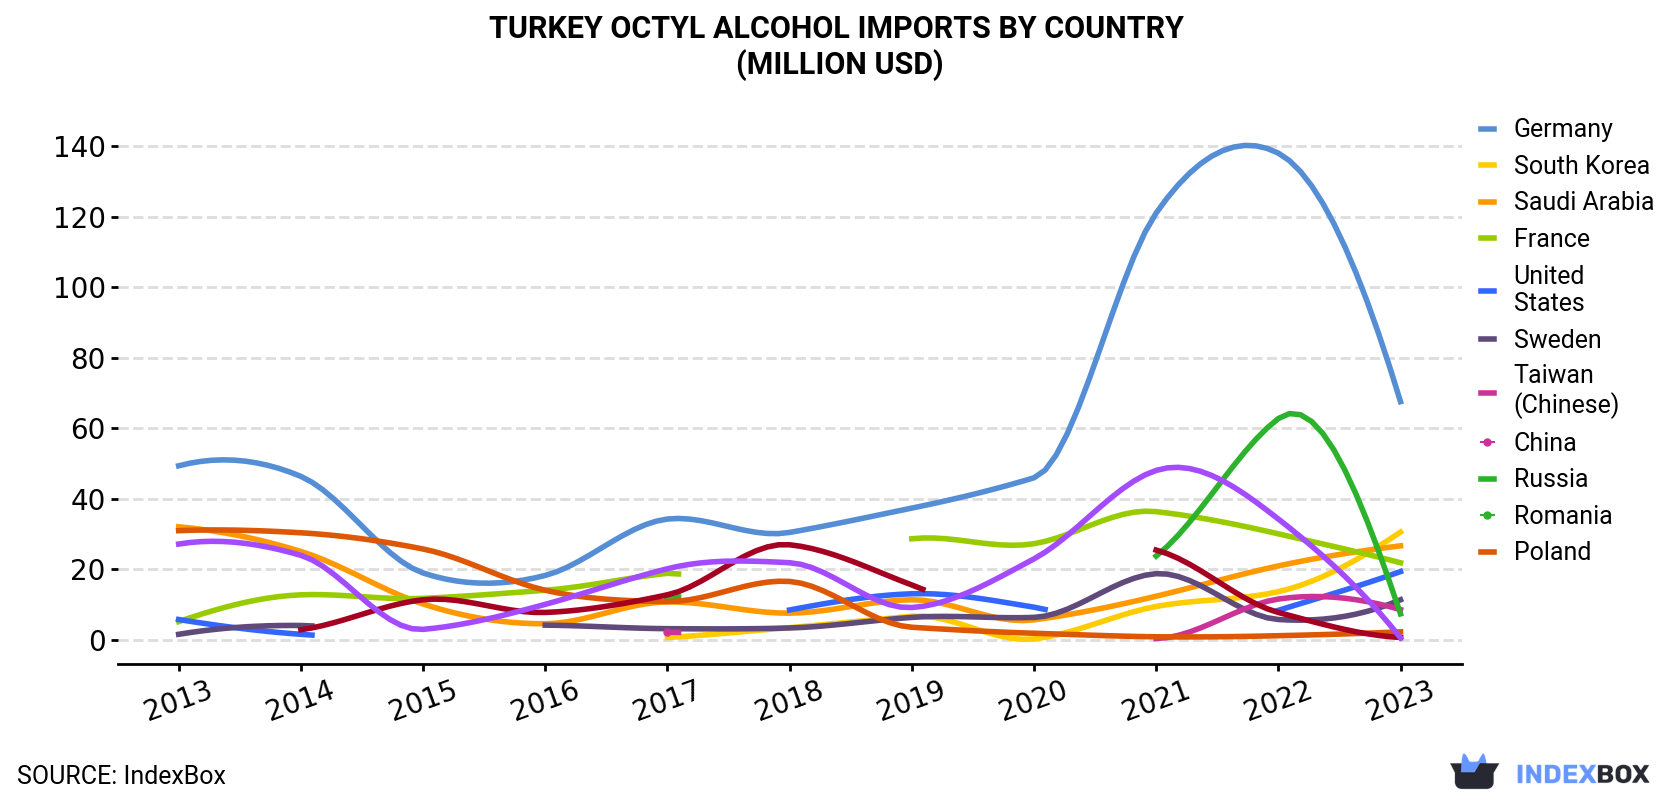
| COUNTRY | Import Value of Octyl Alcohol in Turkey (million USD) | ||||||||||
|---|---|---|---|---|---|---|---|---|---|---|---|
| 2013 | 2014 | 2015 | 2016 | 2017 | 2018 | 2019 | 2020 | 2021 | 2022 | 2023 | |
| Germany | 49.3 | 46.3 | 18.9 | 18.2 | 34.2 | 30.4 | 37.3 | 45.9 | 121 | 138 | 67.5 |
| South Korea | N/A | N/A | N/A | N/A | 0.6 | 3.4 | 6.6 | 0.2 | 9.4 | 13.6 | 30.5 |
| Saudi Arabia | 32.0 | 25.0 | 10.1 | 4.5 | 10.7 | 7.5 | 11.3 | 5.6 | 12.3 | 20.9 | 26.6 |
| France | 5.1 | 12.7 | 11.7 | 14.0 | 18.8 | N/A | 28.6 | 27.2 | 36.3 | 30.0 | 21.8 |
| United States | 5.7 | 1.5 | N/A | N/A | N/A | 8.4 | 13.0 | 9.2 | N/A | 8.3 | 19.3 |
| Sweden | 1.5 | 4.0 | N/A | 4.1 | 3.1 | 3.3 | 6.3 | 6.3 | 18.7 | 5.7 | 11.3 |
| Taiwan (Chinese) | N/A | N/A | N/A | N/A | 2.1 | N/A | N/A | N/A | 0.3 | 11.5 | 8.5 |
| China | N/A | N/A | N/A | N/A | 12.4 | N/A | N/A | N/A | 23.7 | 62.7 | 7.3 |
| Russia | 30.9 | 30.3 | 25.7 | 14.0 | 10.8 | 16.5 | 3.5 | 1.8 | 0.8 | 1.1 | 2.2 |
| Romania | N/A | 2.8 | 11.3 | 7.7 | 12.7 | 26.9 | 15.5 | N/A | 25.4 | 7.7 | 0.6 |
| Poland | 27.1 | 23.9 | 2.9 | 10.0 | 20.1 | 21.8 | 9.1 | 22.9 | 48.0 | 34.2 | 0.5 |
| Others | 1.8 | 3.6 | 5.0 | 2.3 | 0.8 | 7.8 | N/A | N/A | 1.4 | 0.9 | 0.1 |
| Total | 153 | 150 | 85.6 | 74.7 | 126 | 126 | 131 | 119 | 297 | 335 | 196 |
Imports by Country
Germany (51K tons), Saudi Arabia (27K tons) and South Korea (22K tons) were the main suppliers of octyl alcohol imports to Turkey, together comprising 64% of total imports. the United States, France, Sweden, Taiwan (Chinese), China, Russia, Romania and Poland lagged somewhat behind, together comprising a further 36%.
From 2013 to 2023, the most notable rate of growth in terms of purchases, amongst the main suppliers, was attained by China (with a CAGR of +295.4%), while imports for the other leaders experienced more modest paces of growth.
In value terms, Germany ($68M) constituted the largest supplier of octanol (octyl alcohol) and isomers thereof to Turkey, comprising 34% of total imports. The second position in the ranking was held by South Korea ($30M), with a 16% share of total imports. It was followed by Saudi Arabia, with a 14% share.
From 2013 to 2023, the average annual growth rate of value from Germany stood at +3.2%. The remaining supplying countries recorded the following average annual rates of imports growth: South Korea (+91.0% per year) and Saudi Arabia (-1.9% per year).
Import Prices by Country
In 2023, the octyl alcohol price amounted to $1,254 per ton (CIF, Turkey), waning by -30% against the previous year. Over the period under review, the import price showed a abrupt curtailment. The pace of growth appeared the most rapid in 2021 when the average import price increased by 93% against the previous year. Over the period under review, average import prices attained the peak figure at $2,365 per ton in 2013; however, from 2014 to 2023, import prices remained at a lower figure.
Average prices varied somewhat amongst the major supplying countries. In 2023, amid the top importers, the highest price was recorded for prices from South Korea ($1,385 per ton) and China ($1,342 per ton), while the price for Saudi Arabia ($1,000 per ton) and Poland ($1,109 per ton) were amongst the lowest.
From 2013 to 2023, the most notable rate of growth in terms of prices was attained by South Korea (+1.7%), while the prices for the other major suppliers experienced mixed trend patterns.
This report provides an in-depth analysis of the octyl alcohol market in Turkey. Within it, you will discover the latest data on market trends and opportunities by country, consumption, production and price developments, as well as the global trade (imports and exports). The forecast exhibits the market prospects through 2030.
Product coverage:
- Prodcom 20142263 - Octanol (octyl alcohol) and isomers thereof
Country coverage:
- Turkey
Data coverage:
- Market volume and value
- Per Capita consumption
- Forecast of the market dynamics in the medium term
- Trade (exports and imports) in Turkey
- Export and import prices
- Market trends, drivers and restraints
- Key market players and their profiles
Reasons to buy this report:
- Take advantage of the latest data
- Find deeper insights into current market developments
- Discover vital success factors affecting the market
This report is designed for manufacturers, distributors, importers, and wholesalers, as well as for investors, consultants and advisors.
In this report, you can find information that helps you to make informed decisions on the following issues:
- How to diversify your business and benefit from new market opportunities
- How to load your idle production capacity
- How to boost your sales on overseas markets
- How to increase your profit margins
- How to make your supply chain more sustainable
- How to reduce your production and supply chain costs
- How to outsource production to other countries
- How to prepare your business for global expansion
While doing this research, we combine the accumulated expertise of our analysts and the capabilities of artificial intelligence. The AI-based platform, developed by our data scientists, constitutes the key working tool for business analysts, empowering them to discover deep insights and ideas from the marketing data.
-
1. INTRODUCTION
Making Data-Driven Decisions to Grow Your Business
- REPORT DESCRIPTION
- RESEARCH METHODOLOGY AND AI PLATFORM
- DATA-DRIVEN DECISIONS FOR YOUR BUSINESS
- GLOSSARY AND SPECIFIC TERMS
-
2. EXECUTIVE SUMMARY
A Quick Overview of Market Performance
- KEY FINDINGS
- MARKET TRENDS This Chapter is Available Only for the Professional Edition PRO
-
3. MARKET OVERVIEW
Understanding the Current State of The Market and Its Prospects
- MARKET SIZE
- MARKET STRUCTURE
- TRADE BALANCE
- PER CAPITA CONSUMPTION
- MARKET FORECAST TO 2030
-
4. MOST PROMISING PRODUCT
Finding New Products to Diversify Your Business
This Chapter is Available Only for the Professional Edition PRO- TOP PRODUCTS TO DIVERSIFY YOUR BUSINESS
- BEST-SELLING PRODUCTS
- MOST CONSUMED PRODUCT
- MOST TRADED PRODUCT
- MOST PROFITABLE PRODUCT FOR EXPORT
-
5. MOST PROMISING SUPPLYING COUNTRIES
Choosing the Best Countries to Establish Your Sustainable Supply Chain
This Chapter is Available Only for the Professional Edition PRO- TOP COUNTRIES TO SOURCE YOUR PRODUCT
- TOP PRODUCING COUNTRIES
- TOP EXPORTING COUNTRIES
- LOW-COST EXPORTING COUNTRIES
-
6. MOST PROMISING OVERSEAS MARKETS
Choosing the Best Countries to Boost Your Exports
This Chapter is Available Only for the Professional Edition PRO- TOP OVERSEAS MARKETS FOR EXPORTING YOUR PRODUCT
- TOP CONSUMING MARKETS
- UNSATURATED MARKETS
- TOP IMPORTING MARKETS
- MOST PROFITABLE MARKETS
7. PRODUCTION
The Latest Trends and Insights into The Industry
- PRODUCTION VOLUME AND VALUE
8. IMPORTS
The Largest Import Supplying Countries
- IMPORTS FROM 2012–2023
- IMPORTS BY COUNTRY
- IMPORT PRICES BY COUNTRY
9. EXPORTS
The Largest Destinations for Exports
- EXPORTS FROM 2012–2023
- EXPORTS BY COUNTRY
- EXPORT PRICES BY COUNTRY
-
10. PROFILES OF MAJOR PRODUCERS
The Largest Producers on The Market and Their Profiles
This Chapter is Available Only for the Professional Edition PRO -
LIST OF TABLES
- Key Findings In 2023
- Market Volume, In Physical Terms, 2012–2023
- Market Value, 2012–2023
- Per Capita Consumption In 2012-2023
- Imports, In Physical Terms, By Country, 2012–2023
- Imports, In Value Terms, By Country, 2012–2023
- Import Prices, By Country Of Origin, 2012–2023
- Exports, In Physical Terms, By Country, 2012–2023
- Exports, In Value Terms, By Country, 2012–2023
- Export Prices, By Country Of Destination, 2012–2023
-
LIST OF FIGURES
- Market Volume, In Physical Terms, 2012–2023
- Market Value, 2012–2023
- Market Structure – Domestic Supply vs. Imports, In Physical Terms, 2012-2023
- Market Structure – Domestic Supply vs. Imports, In Value Terms, 2012-2023
- Trade Balance, In Physical Terms, 2012-2023
- Trade Balance, In Value Terms, 2012-2023
- Per Capita Consumption, 2012-2023
- Market Volume Forecast to 2030
- Market Value Forecast to 2030
- Products: Market Size And Growth, By Type
- Products: Average Per Capita Consumption, By Type
- Products: Exports And Growth, By Type
- Products: Export Prices And Growth, By Type
- Production Volume And Growth
- Exports And Growth
- Export Prices And Growth
- Market Size And Growth
- Per Capita Consumption
- Imports And Growth
- Import Prices
- Production, In Physical Terms, 2012–2023
- Production, In Value Terms, 2012–2023
- Imports, In Physical Terms, 2012–2023
- Imports, In Value Terms, 2012–2023
- Imports, In Physical Terms, By Country, 2023
- Imports, In Physical Terms, By Country, 2012–2023
- Imports, In Value Terms, By Country, 2012–2023
- Import Prices, By Country Of Origin, 2012–2023
- Exports, In Physical Terms, 2012–2023
- Exports, In Value Terms, 2012–2023
- Exports, In Physical Terms, By Country, 2023
- Exports, In Physical Terms, By Country, 2012–2023
- Exports, In Value Terms, By Country, 2012–2023
- Export Prices, By Country Of Destination, 2012–2023


