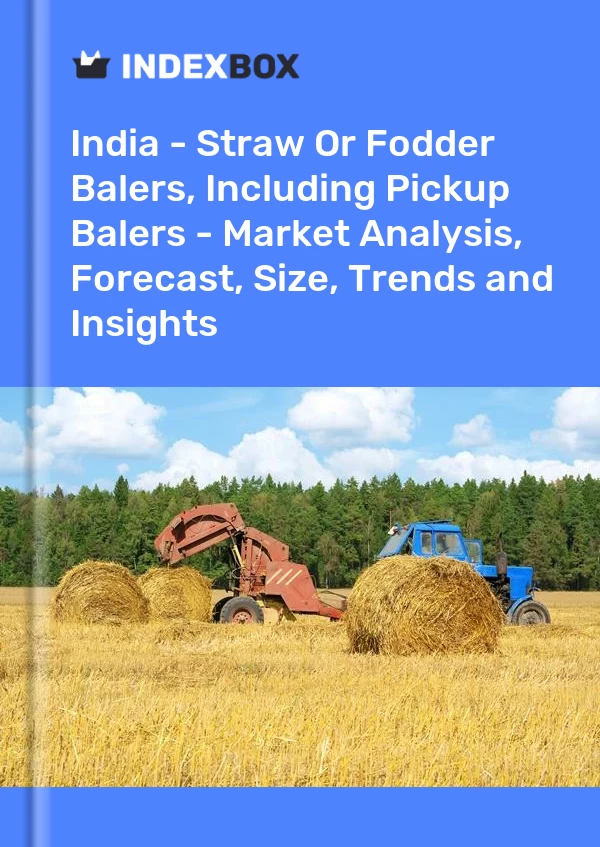
India - Straw Or Fodder Balers, Including Pickup Balers - Market Analysis, Forecast, Size, Trends and Insights
Get instant access to more than 2 million reports, dashboards, and datasets on the IndexBox Platform.
View PricingPrice for Straw for Fodder Balers in India - 2023
Contents:
- Price for Straw for Fodder Balers in India (CIF) - 2022
- Price for Straw for Fodder Balers in India (FOB) - 2022
- Imports of Straw for Fodder Balers in India
- Exports of Straw for Fodder Balers in India
Price for Straw for Fodder Balers in India (CIF) - 2022
In 2022, the average straw for fodder balers import price amounted to $18,066 per unit, picking up by 2.2% against the previous year. Over the period under review, the import price, however, showed a relatively flat trend pattern. The most prominent rate of growth was recorded in 2018 when the average import price increased by 10% against the previous year. The import price peaked at $19,020 per unit in 2014; however, from 2015 to 2022, import prices remained at a lower figure.
Average prices varied noticeably amongst the major supplying countries. In 2022, amid the top importers, the highest price was recorded for prices from Norway ($18,066 per unit) and Poland ($18,066 per unit), while the price for the United States ($18,066 per unit) and China ($18,066 per unit) were amongst the lowest.
From 2012 to 2022, the most notable rate of growth in terms of prices was attained by Belgium (+0.5%), while the prices for the other major suppliers experienced mixed trend patterns.
Price for Straw for Fodder Balers in India (FOB) - 2022
In 2022, the average straw for fodder balers export price amounted to $17,255 per unit, which is down by -1.6% against the previous year. Over the last decade, it increased at an average annual rate of +4.2%. The growth pace was the most rapid in 2013 when the average export price increased by 35%. Over the period under review, the average export prices attained the peak figure at $18,460 per unit in 2014; however, from 2015 to 2022, the export prices remained at a lower figure.
Average prices varied noticeably for the major overseas markets. In 2022, amid the top suppliers, the highest price was recorded for prices to Vietnam ($17,255 per unit) and Romania ($17,255 per unit), while the average price for exports to Morocco ($17,255 per unit) and Nepal ($17,255 per unit) were amongst the lowest.
From 2012 to 2022, the most notable rate of growth in terms of prices was recorded for supplies to Vietnam (+2.2%), while the prices for the other major destinations experienced more modest paces of growth.
Imports of Straw for Fodder Balers in India
In 2022, approx. 248 units of straw or fodder balers, including pickup balers were imported into India; which is down by -43.8% against 2021. Over the period under review, imports recorded a deep slump. The pace of growth was the most pronounced in 2021 with an increase of 27% against the previous year. As a result, imports reached the peak of 441 units, and then declined rapidly in the following year.
In value terms, straw for fodder balers imports contracted dramatically to $4.5M in 2022. Overall, imports showed a deep reduction. The pace of growth appeared the most rapid in 2021 when imports increased by 26% against the previous year. As a result, imports reached the peak of $7.8M, and then dropped notably in the following year.
| Import of Straw for Fodder Balers in India (Thousand USD) | |||||
|---|---|---|---|---|---|
| COUNTRY | 2019 | 2020 | 2021 | 2022 | CAGR, 2019-2022 |
| Belgium | 64.7 | 114 | 69.8 | 1,303 | 172.1% |
| China | 3,846 | 4,583 | 4,866 | 1,059 | -34.9% |
| Italy | 992 | 311 | 65.5 | 665 | -12.5% |
| Turkey | 1,608 | 827 | 1,999 | 530 | -30.9% |
| Germany | 152 | 138 | 318 | 310 | 26.8% |
| Norway | 311 | 169 | 325 | 294 | -1.9% |
| Poland | 164 | N/A | 148 | 140 | -5.1% |
| Others | 239 | 32.7 | 6.4 | 172 | -10.4% |
| Total | 7,377 | 6,174 | 7,799 | 4,473 | -15.4% |
Top Suppliers of Straw for Fodder Balers to India in 2022:
- Belgium (72.0 units)
- China (59.0 units)
- Italy (37.0 units)
- Turkey (29.0 units)
- Germany (17.0 units)
- Norway (16.0 units)
- Poland (8.0 units)
Exports of Straw for Fodder Balers in India
In 2022, exports of straw or fodder balers, including pickup balers from India surged to 190 units, growing by 23% against 2021 figures. Overall, exports posted a significant increase. The most prominent rate of growth was recorded in 2021 with an increase of 78%. The exports peaked in 2022 and are likely to continue growth in the near future.
In value terms, straw for fodder balers exports soared to $3.3M in 2022. Over the period under review, exports showed a significant expansion. The growth pace was the most rapid in 2021 with an increase of 86%. The exports peaked in 2022 and are likely to see steady growth in the immediate term.
| Export of Straw for Fodder Balers in India (Thousand USD) | |||||
|---|---|---|---|---|---|
| COUNTRY | 2019 | 2020 | 2021 | 2022 | CAGR, 2019-2022 |
| South Africa | N/A | N/A | 28.7 | 393 | 1269.3% |
| United States | N/A | 5.9 | 43.9 | 296 | 608.3% |
| Kenya | 55.6 | 31.8 | 22.0 | 294 | 74.2% |
| Germany | 21.2 | 6.1 | 62.4 | 265 | 132.1% |
| Nepal | 209 | 71.0 | 171 | 189 | -3.3% |
| Greece | N/A | 9.2 | 23.0 | 158 | 314.4% |
| Turkey | 87.3 | 290 | 146 | 153 | 20.6% |
| Czech Republic | N/A | N/A | 3.2 | 150 | 4587.5% |
| Vietnam | 61.9 | 161 | 88.9 | 135 | 29.7% |
| Thailand | 135 | 233 | 742 | 132 | -0.7% |
| Romania | N/A | N/A | N/A | 113 | 0% |
| Morocco | N/A | N/A | 49.3 | 110 | 123.1% |
| Algeria | 139 | 154 | 93.6 | 106 | -8.6% |
| Others | 669 | 500 | 1,244 | 783 | 5.4% |
| Total | 1,378 | 1,463 | 2,718 | 3,275 | 33.5% |
Top Export Markets for Straw for Fodder Balers from India in 2022:
- South Africa (23.0 units)
- United States (17.0 units)
- Kenya (17.0 units)
- Germany (15.0 units)
- Nepal (11.0 units)
- Turkey (9.0 units)
- Czech Republic (9.0 units)
- Greece (9.0 units)
- Vietnam (8.0 units)
- Thailand (8.0 units)
- Romania (7.0 units)
- Algeria (6.0 units)
- Morocco (6.0 units)
This report provides an in-depth analysis of the market for straw for fodder balers in India. Within it, you will discover the latest data on market trends and opportunities by country, consumption, production and price developments, as well as the global trade (imports and exports). The forecast exhibits the market prospects through 2030.
Product coverage:
- Prodcom 28305330 -
- Prodcom 28305350 -
- Prodcom 28305340 - Straw or fodder balers, including pick-up balers
Country coverage:
- India
Data coverage:
- Market volume and value
- Per Capita consumption
- Forecast of the market dynamics in the medium term
- Trade (exports and imports) in India
- Export and import prices
- Market trends, drivers and restraints
- Key market players and their profiles
Reasons to buy this report:
- Take advantage of the latest data
- Find deeper insights into current market developments
- Discover vital success factors affecting the market
This report is designed for manufacturers, distributors, importers, and wholesalers, as well as for investors, consultants and advisors.
In this report, you can find information that helps you to make informed decisions on the following issues:
- How to diversify your business and benefit from new market opportunities
- How to load your idle production capacity
- How to boost your sales on overseas markets
- How to increase your profit margins
- How to make your supply chain more sustainable
- How to reduce your production and supply chain costs
- How to outsource production to other countries
- How to prepare your business for global expansion
While doing this research, we combine the accumulated expertise of our analysts and the capabilities of artificial intelligence. The AI-based platform, developed by our data scientists, constitutes the key working tool for business analysts, empowering them to discover deep insights and ideas from the marketing data.
-
1. INTRODUCTION
Making Data-Driven Decisions to Grow Your Business
- REPORT DESCRIPTION
- RESEARCH METHODOLOGY AND AI PLATFORM
- DATA-DRIVEN DECISIONS FOR YOUR BUSINESS
- GLOSSARY AND SPECIFIC TERMS
-
2. EXECUTIVE SUMMARY
A Quick Overview of Market Performance
- KEY FINDINGS
- MARKET TRENDS This Chapter is Available Only for the Professional Edition PRO
-
3. MARKET OVERVIEW
Understanding the Current State of The Market and Its Prospects
- MARKET SIZE
- MARKET STRUCTURE
- TRADE BALANCE
- PER CAPITA CONSUMPTION
- MARKET FORECAST TO 2030
-
4. MOST PROMISING PRODUCT
Finding New Products to Diversify Your Business
This Chapter is Available Only for the Professional Edition PRO- TOP PRODUCTS TO DIVERSIFY YOUR BUSINESS
- BEST-SELLING PRODUCTS
- MOST CONSUMED PRODUCT
- MOST TRADED PRODUCT
- MOST PROFITABLE PRODUCT FOR EXPORT
-
5. MOST PROMISING SUPPLYING COUNTRIES
Choosing the Best Countries to Establish Your Sustainable Supply Chain
This Chapter is Available Only for the Professional Edition PRO- TOP COUNTRIES TO SOURCE YOUR PRODUCT
- TOP PRODUCING COUNTRIES
- TOP EXPORTING COUNTRIES
- LOW-COST EXPORTING COUNTRIES
-
6. MOST PROMISING OVERSEAS MARKETS
Choosing the Best Countries to Boost Your Exports
This Chapter is Available Only for the Professional Edition PRO- TOP OVERSEAS MARKETS FOR EXPORTING YOUR PRODUCT
- TOP CONSUMING MARKETS
- UNSATURATED MARKETS
- TOP IMPORTING MARKETS
- MOST PROFITABLE MARKETS
7. PRODUCTION
The Latest Trends and Insights into The Industry
- PRODUCTION VOLUME AND VALUE
8. IMPORTS
The Largest Import Supplying Countries
- IMPORTS FROM 2012–2023
- IMPORTS BY COUNTRY
- IMPORT PRICES BY COUNTRY
9. EXPORTS
The Largest Destinations for Exports
- EXPORTS FROM 2012–2023
- EXPORTS BY COUNTRY
- EXPORT PRICES BY COUNTRY
-
10. PROFILES OF MAJOR PRODUCERS
The Largest Producers on The Market and Their Profiles
This Chapter is Available Only for the Professional Edition PRO -
LIST OF TABLES
- Key Findings In 2023
- Market Volume, In Physical Terms, 2012–2023
- Market Value, 2012–2023
- Per Capita Consumption In 2012-2023
- Imports, In Physical Terms, By Country, 2012–2023
- Imports, In Value Terms, By Country, 2012–2023
- Import Prices, By Country Of Origin, 2012–2023
- Exports, In Physical Terms, By Country, 2012–2023
- Exports, In Value Terms, By Country, 2012–2023
- Export Prices, By Country Of Destination, 2012–2023
-
LIST OF FIGURES
- Market Volume, In Physical Terms, 2012–2023
- Market Value, 2012–2023
- Market Structure – Domestic Supply vs. Imports, In Physical Terms, 2012-2023
- Market Structure – Domestic Supply vs. Imports, In Value Terms, 2012-2023
- Trade Balance, In Physical Terms, 2012-2023
- Trade Balance, In Value Terms, 2012-2023
- Per Capita Consumption, 2012-2023
- Market Volume Forecast to 2030
- Market Value Forecast to 2030
- Products: Market Size And Growth, By Type
- Products: Average Per Capita Consumption, By Type
- Products: Exports And Growth, By Type
- Products: Export Prices And Growth, By Type
- Production Volume And Growth
- Exports And Growth
- Export Prices And Growth
- Market Size And Growth
- Per Capita Consumption
- Imports And Growth
- Import Prices
- Production, In Physical Terms, 2012–2023
- Production, In Value Terms, 2012–2023
- Imports, In Physical Terms, 2012–2023
- Imports, In Value Terms, 2012–2023
- Imports, In Physical Terms, By Country, 2023
- Imports, In Physical Terms, By Country, 2012–2023
- Imports, In Value Terms, By Country, 2012–2023
- Import Prices, By Country Of Origin, 2012–2023
- Exports, In Physical Terms, 2012–2023
- Exports, In Value Terms, 2012–2023
- Exports, In Physical Terms, By Country, 2023
- Exports, In Physical Terms, By Country, 2012–2023
- Exports, In Value Terms, By Country, 2012–2023
- Export Prices, By Country Of Destination, 2012–2023
This report provides an in-depth analysis of the market for straw for fodder balers in India.
This report provides an in-depth analysis of the market for root or tuber harvesting machine in India.
This report provides an in-depth analysis of the potato harvester market in India.
This report provides an in-depth analysis of the market for parts of harvester and threshers in India.
This report provides an in-depth analysis of the non-lawn mower market in India.
This report provides an in-depth analysis of the combine harvester market in India.
This report provides an in-depth analysis of the non-electric mower market in India.
This report provides an in-depth analysis of the food sorting machine market in India.
This report provides an in-depth analysis of the hay-making machinery market in India.
This report provides an in-depth analysis of the agricultural harvester market in India.
During the review period, the imports of Combine Harvesters reached its highest point in September 2023, with a total of 1.6K units. However, the following month witnessed a rapid decline in imports. In terms of value, the import of Combine Harvesters dropped significantly to $6.7M in October 2023.
Threshing Machinery exports reached a peak of 1.4K units in 2021 but failed to regain momentum from 2022 to 2023. In terms of value, exports were at $5.4M in 2023.
Imports of colloidal precious metals reached a peak in 2023 and are projected to continue growing. The value of these imports decreased to $1.7B in 2023.
Discover the latest trends in the combine harvester-thresher market and projections for the next seven years. With a projected increase in market volume to 244K units and market value to $22.6B by 2030, this sector is set for continued growth.
Explore the top import markets for combine harvesters in 2023. Learn about the key countries driving demand for agricultural machinery.
In 2016, approx. X tons of combine harvester were imported worldwide- jumping by X% against the previous year level. The total import volume increased at an average annual rate of +X% from 2007...
In 2016, approx. X tons of combine harvester were imported worldwide- jumping by X% against the previous year level. The total import volume increased at an average annual rate of +X% from 2007...
The global trade in combine harvester-threshers fluctuated strongly over the period under review. After a X% drop in 2009, exports continued falling in 2010 and proceeded to recover for the next three years. After a pronou
Although it experienced a down year in exports, the U.S. continued to lead the way in the global combine harvester-thresher trade. In 2014, the U.S. exported X combine harvester-threshers totaling X million USD, X% under the previous year. Its
Explore the top countries leading the import market for mowers for lawns, parks, or sports grounds. Learn about the key players driving demand for landscaping tools globally.


