World - Diammonium Phosphate (DAP) - Market Analysis, Forecast, Size, Trends And Insights
Get instant access to more than 2 million reports, dashboards, and datasets on the IndexBox Platform.
View PricingThe World's Best Import Markets for Diammonium Phosphate
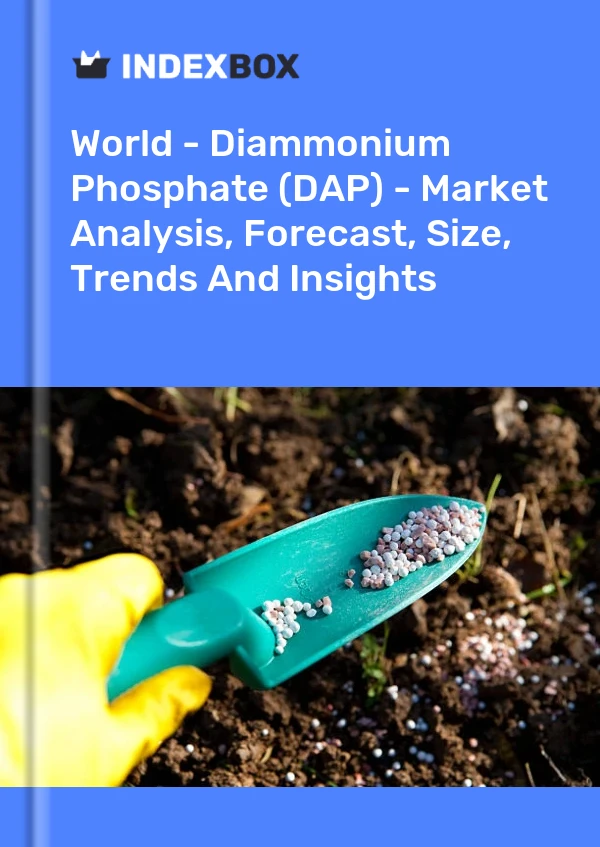
Diammonium phosphate (DAP) is a widely used fertilizer that contains nitrogen and phosphorus, two essential nutrients for plant growth. It is primarily used in agriculture to improve soil fertility and increase crop yields. As agriculture plays a crucial role in global food production, the demand for diammonium phosphate is steadily increasing. In this article, we will explore the top import markets for diammonium phosphate based on data from the IndexBox market intelligence platform.
1. India: The Largest Importer of Diammonium Phosphate
India, with an import value of $6.0 billion in 2022, is the largest importer of diammonium phosphate in the world. The country has a vast agricultural sector, leading to high demand for fertilizers. Diammonium phosphate is widely used across various crops, including cereals, fruits, vegetables, and pulses. With a growing population and increasing focus on food security, India's demand for diammonium phosphate is expected to continue rising.
2. Bangladesh: A Promising Market for Diammonium Phosphate
With an import value of $530.5 million in 2022, Bangladesh emerges as one of the key importers of diammonium phosphate. The country heavily relies on agriculture, contributing significantly to its economy. Bangladesh imports diammonium phosphate to enhance crop productivity and meet the growing demand for food. The government's initiatives to promote sustainable and efficient agricultural practices further contribute to the demand for fertilizers like diammonium phosphate.
3. Pakistan: Meeting Agricultural Needs with Imports
Pakistan, with an import value of $457.1 million in 2022, is another prominent market for diammonium phosphate. The country has an agriculture-based economy, and fertilizers like diammonium phosphate play a crucial role in sustaining crop yields. Pakistan imports diammonium phosphate to meet its domestic agricultural needs, particularly for staple crops like wheat, rice, and cotton. The government's focus on promoting agricultural productivity and ensuring food security drives the demand for diammonium phosphate.
4. Japan: Diammonium Phosphate for Efficient Farming
Japan, known for its advanced agricultural practices, imports diammonium phosphate worth $433.5 million in 2022. The country places a strong emphasis on efficient farming to maximize yields in limited arable land. Diammonium phosphate is an essential fertilizer that helps optimize nutrient absorption, leading to increased crop output. With a highly developed agricultural industry, Japan's demand for diammonium phosphate remains consistently high.
5. United States: Importing Diammonium Phosphate for Agriculture
The United States, with an import value of $409.3 million in 2022, is a significant importer of diammonium phosphate. The country has a diverse agricultural landscape, ranging from large-scale commercial farms to small family-owned operations. Diammonium phosphate is widely used across various crops, including corn, wheat, soybeans, and vegetables. The demand for diammonium phosphate in the United States is driven by the need to improve soil fertility, increase crop production, and ensure sustainable farming practices.
6. Indonesia: Boosting Agricultural Productivity
Indonesia imports diammonium phosphate worth $338.8 million in 2022, making it a significant market for this fertilizer. The country's agricultural sector plays a vital role in its economy, and diammonium phosphate is used extensively to boost crop productivity. Indonesia's focus on achieving self-sufficiency in food production and promoting modern agricultural practices contributes to the growing demand for diammonium phosphate.
7. Argentina: Enhancing Agricultural Output
Argentina, with an import value of $262.5 million in 2022, is a prominent market for diammonium phosphate in South America. The country has a rich agricultural heritage, with crops like soybean, corn, and wheat being its primary agricultural commodities. Diammonium phosphate is used extensively to enhance soil fertility and increase agricultural output. Argentina's export-oriented agriculture and a thriving livestock industry contribute to the demand for diammonium phosphate.
8. Brazil: Meeting the Agricultural Needs of a Vast Nation
Brazil, with an import value of $208.7 million in 2022, is another significant market for diammonium phosphate. The country has immense agricultural potential, with a vast expanse of arable land. Diammonium phosphate is used widely in Brazil to improve soil fertility, enhance crop yields, and promote sustainable farming practices. With a growing population and increasing demand for food, Brazil's reliance on diammonium phosphate imports is expected to continue.
9. Turkey: Fostering Agricultural Productivity
Turkey, with an import value of $200.6 million in 2022, is an emerging market for diammonium phosphate in Europe. The country has a diverse agricultural sector, ranging from traditional family-owned farms to modern commercial operations. Diammonium phosphate is used extensively across various crops, including wheat, barley, corn, and cotton. Turkey's focus on fostering agricultural productivity and ensuring food security drives the demand for diammonium phosphate.
10. Vietnam: Importing Diammonium Phosphate for Crop Enhancement
Vietnam, with an import value of $197.7 million in 2022, is a key market for diammonium phosphate in Southeast Asia. The country's agricultural sector is rapidly expanding, fueled by government support and favorable climatic conditions. Diammonium phosphate is imported to enhance crop productivity and improve soil fertility, particularly for crops like rice, coffee, and rubber. Vietnam's focus on agricultural modernization and sustainable farming practices contributes to the increasing demand for diammonium phosphate.
In conclusion, the world's best import markets for diammonium phosphate include India, Bangladesh, Pakistan, Japan, the United States, Indonesia, Argentina, Brazil, Turkey, and Vietnam. These countries have robust agricultural sectors and rely on diammonium phosphate to enhance crop productivity and meet the growing demand for food. The data for this article was sourced from the IndexBox market intelligence platform, which provides valuable insights and statistics on global import markets.
This report provides an in-depth analysis of the global diammonium phosphate market. Within it, you will discover the latest data on market trends and opportunities by country, consumption, production and price developments, as well as the global trade (imports and exports). The forecast exhibits the market prospects through 2030.
Product coverage:
- FCL 4022 - Diammonium phosphate (DAP)
Country coverage:
Worldwide - the report contains statistical data for 200 countries and includes detailed profiles of the 50 largest consuming countries:
- USA
- China
- Japan
- Germany
- United Kingdom
- France
- Brazil
- Italy
- Russian Federation
- India
- Canada
- Australia
- Republic of Korea
- Spain
- Mexico
- Indonesia
- Netherlands
- Turkey
- Saudi Arabia
- Switzerland
- Sweden
- Nigeria
- Poland
- Belgium
- Argentina
- Norway
- Austria
- Thailand
- United Arab Emirates
- Colombia
- Denmark
- South Africa
- Malaysia
- Israel
- Singapore
- Egypt
- Philippines
- Finland
- Chile
- Ireland
- Pakistan
- Greece
- Portugal
- Kazakhstan
- Algeria
- Czech Republic
- Qatar
- Peru
- Romania
- Vietnam
+ the largest producing countries
Data coverage:
- Global market volume and value
- Per Capita consumption
- Forecast of the market dynamics in the medium term
- Global production, split by region and country
- Global trade (exports and imports)
- Export and import prices
- Market trends, drivers and restraints
- Key market players and their profiles
Company coverage:
Reasons to buy this report:
- Take advantage of the latest data
- Find deeper insights into current market developments
- Discover vital success factors affecting the market
This report is designed for manufacturers, distributors, importers, and wholesalers, as well as for investors, consultants and advisors.
In this report, you can find information that helps you to make informed decisions on the following issues:
- How to diversify your business and benefit from new market opportunities
- How to load your idle production capacity
- How to boost your sales on overseas markets
- How to increase your profit margins
- How to make your supply chain more sustainable
- How to reduce your production and supply chain costs
- How to outsource production to other countries
- How to prepare your business for global expansion
While doing this research, we combine the accumulated expertise of our analysts and the capabilities of artificial intelligence. The AI-based platform, developed by our data scientists, constitutes the key working tool for business analysts, empowering them to discover deep insights and ideas from the marketing data.
-
1. INTRODUCTION
Making Data-Driven Decisions to Grow Your Business
- REPORT DESCRIPTION
- RESEARCH METHODOLOGY AND AI PLATFORM
- DATA-DRIVEN DECISIONS FOR YOUR BUSINESS
- GLOSSARY AND SPECIFIC TERMS
-
2. EXECUTIVE SUMMARY
A Quick Overview of Market Performance
- KEY FINDINGS
- MARKET TRENDS This Chapter is Available Only for the Professional Edition PRO
-
3. MARKET OVERVIEW
Understanding the Current State of The Market and Its Prospects
- MARKET SIZE
- CONSUMPTION BY COUNTRY
- MARKET FORECAST TO 2030
-
4. MOST PROMISING PRODUCT
Finding New Products to Diversify Your Business
This Chapter is Available Only for the Professional Edition PRO- TOP PRODUCTS TO DIVERSIFY YOUR BUSINESS
- BEST-SELLING PRODUCTS
- MOST CONSUMED PRODUCT
- MOST TRADED PRODUCT
- MOST PROFITABLE PRODUCT FOR EXPORT
-
5. MOST PROMISING SUPPLYING COUNTRIES
Choosing the Best Countries to Establish Your Sustainable Supply Chain
This Chapter is Available Only for the Professional Edition PRO- TOP COUNTRIES TO SOURCE YOUR PRODUCT
- TOP PRODUCING COUNTRIES
- TOP EXPORTING COUNTRIES
- LOW-COST EXPORTING COUNTRIES
-
6. MOST PROMISING OVERSEAS MARKETS
Choosing the Best Countries to Boost Your Exports
This Chapter is Available Only for the Professional Edition PRO- TOP OVERSEAS MARKETS FOR EXPORTING YOUR PRODUCT
- TOP CONSUMING MARKETS
- UNSATURATED MARKETS
- TOP IMPORTING MARKETS
- MOST PROFITABLE MARKETS
7. GLOBAL PRODUCTION
The Latest Trends and Insights into The Industry
- PRODUCTION VOLUME AND VALUE
- PRODUCTION BY COUNTRY
8. GLOBAL IMPORTS
The Largest Importers on The Market and How They Succeed
- IMPORTS FROM 2012–2023
- IMPORTS BY COUNTRY
- IMPORT PRICES BY COUNTRY
9. GLOBAL EXPORTS
The Largest Exporters on The Market and How They Succeed
- EXPORTS FROM 2012–2023
- EXPORTS BY COUNTRY
- EXPORT PRICES BY COUNTRY
-
10. PROFILES OF MAJOR PRODUCERS
The Largest Producers on The Market and Their Profiles
This Chapter is Available Only for the Professional Edition PRO -
11. COUNTRY PROFILES
The Largest Markets And Their Profiles
This Chapter is Available Only for the Professional Edition PRO- United States
- China
- Japan
- Germany
- United Kingdom
- France
- Brazil
- Italy
- Russian Federation
- India
- Canada
- Australia
- Republic of Korea
- Spain
- Mexico
- Indonesia
- Netherlands
- Turkey
- Saudi Arabia
- Switzerland
- Sweden
- Nigeria
- Poland
- Belgium
- Argentina
- Norway
- Austria
- Thailand
- United Arab Emirates
- Colombia
- Denmark
- South Africa
- Malaysia
- Israel
- Singapore
- Egypt
- Philippines
- Finland
- Chile
- Ireland
- Pakistan
- Greece
- Portugal
- Kazakhstan
- Algeria
- Czech Republic
- Qatar
- Peru
- Romania
- Vietnam
-
LIST OF TABLES
- Key Findings In 2023
- Market Volume, In Physical Terms, 2012–2023
- Market Value, 2012–2023
- Per Capita Consumption, By Country, 2018–2023
- Production, In Physical Terms, By Country, 2012–2023
- Imports, In Physical Terms, By Country, 2012–2023
- Imports, In Value Terms, By Country, 2012–2023
- Import Prices, By Country Of Destination, 2012–2023
- Exports, In Physical Terms, By Country, 2012–2023
- Exports, In Value Terms, By Country, 2012–2023
- Export Prices, By Country Of Origin, 2012–2023
-
LIST OF FIGURES
- Market Volume, In Physical Terms, 2012–2023
- Market Value, 2012–2023
- Consumption, By Country, 2023
- Market Volume Forecast to 2030
- Market Value Forecast to 2030
- Products: Market Size And Growth, By Type
- Products: Average Per Capita Consumption, By Type
- Products: Exports And Growth, By Type
- Products: Export Prices And Growth, By Type
- Production Volume And Growth
- Exports And Growth
- Export Prices And Growth
- Market Size And Growth
- Per Capita Consumption
- Imports And Growth
- Import Prices
- Production, In Physical Terms, 2012–2023
- Production, In Value Terms, 2012–2023
- Production, By Country, 2023
- Production, In Physical Terms, By Country, 2012–2023
- Imports, In Physical Terms, 2012–2023
- Imports, In Value Terms, 2012–2023
- Imports, In Physical Terms, By Country, 2023
- Imports, In Physical Terms, By Country, 2012–2023
- Imports, In Value Terms, By Country, 2012–2023
- Import Prices, By Country, 2012–2023
- Exports, In Physical Terms, 2012–2023
- Exports, In Value Terms, 2012–2023
- Exports, In Physical Terms, By Country, 2023
- Exports, In Physical Terms, By Country, 2012–2023
- Exports, In Value Terms, By Country, 2012–2023
- Export Prices, 2012–2023


