
Spain - Pork (Meat Of Swine) - Market Analysis, Forecast, Size, Trends and Insights
Get instant access to more than 2 million reports, dashboards, and datasets on the IndexBox Platform.
View PricingSpain Sees Significant Rise in Pork Exports Reaching $7B by 2023
Spain Pork Exports
In 2023, overseas shipments of pork decreased by -7.8% to 1.9M tons, falling for the second consecutive year after nine years of growth. Over the period under review, exports, however, enjoyed a prominent increase. The growth pace was the most rapid in 2020 when exports increased by 24%. Over the period under review, the exports hit record highs at 2.2M tons in 2021; however, from 2022 to 2023, the exports remained at a lower figure.
In value terms, pork exports rose significantly to $7B (IndexBox estimates) in 2023. Overall, exports, however, continue to indicate a resilient increase. The most prominent rate of growth was recorded in 2019 when exports increased by 27%. Over the period under review, the exports hit record highs in 2023 and are expected to retain growth in years to come.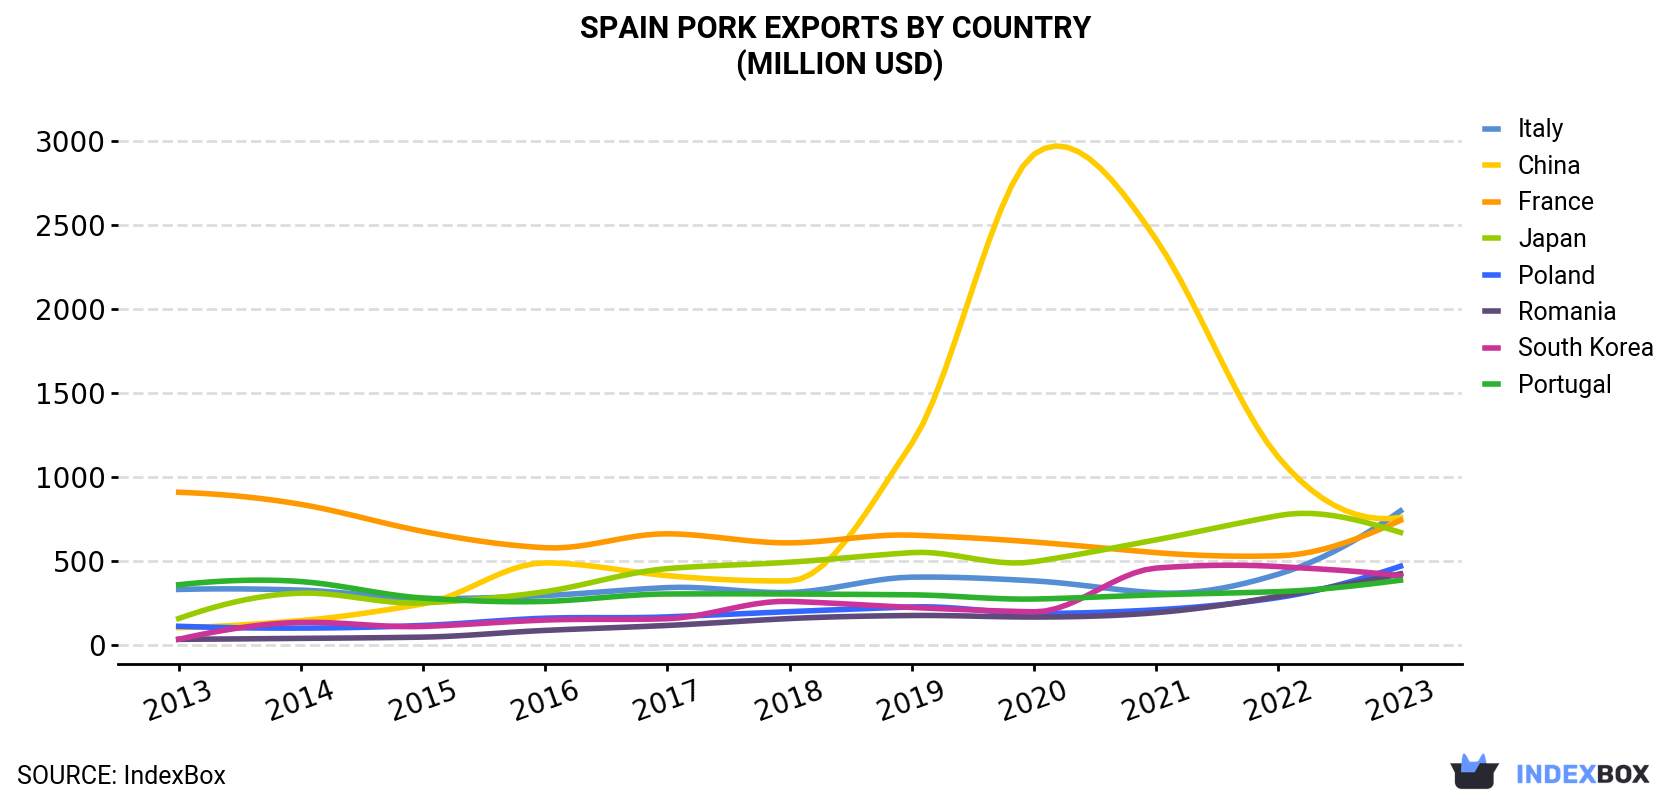
| COUNTRY | Export Value of Pork in Spain (million USD) | ||||||||||
|---|---|---|---|---|---|---|---|---|---|---|---|
| 2013 | 2014 | 2015 | 2016 | 2017 | 2018 | 2019 | 2020 | 2021 | 2022 | 2023 | |
| Italy | 333 | 329 | 279 | 297 | 344 | 315 | 406 | 384 | 313 | 424 | 800 |
| China | 106 | 148 | 247 | 491 | 415 | 384 | 1,201 | 2,921 | 2,414 | 1,119 | 761 |
| France | 911 | 839 | 678 | 581 | 664 | 610 | 656 | 615 | 552 | 533 | 744 |
| Japan | 160 | 311 | 253 | 320 | 457 | 495 | 552 | 498 | 628 | 772 | 672 |
| Poland | 114 | 103 | 119 | 162 | 170 | 201 | 229 | 191 | 212 | 285 | 471 |
| Romania | 36.4 | 42.1 | 49.6 | 89.5 | 119 | 160 | 178 | 169 | 195 | 292 | 426 |
| South Korea | 36.7 | 137 | 113 | 151 | 159 | 262 | 226 | 200 | 460 | 469 | 414 |
| Portugal | 361 | 380 | 282 | 262 | 306 | 306 | 301 | 276 | 301 | 320 | 388 |
| Others | 1,068 | 1,022 | 956 | 1,151 | 1,329 | 1,297 | 1,380 | 1,216 | 1,446 | 1,927 | 2,373 |
| Total | 3,125 | 3,311 | 2,976 | 3,505 | 3,964 | 4,031 | 5,130 | 6,472 | 6,521 | 6,143 | 7,048 |
Exports by Country
China (295K tons), Italy (244K tons) and France (193K tons) were the main destinations of pork exports from Spain, together accounting for 38% of total exports. Japan, Poland, Romania, South Korea and Portugal lagged somewhat behind, together accounting for a further 30%.
From 2013 to 2023, the biggest increases were recorded for Romania (with a CAGR of +23.5%), while shipments for the other leaders experienced more modest paces of growth.
In value terms, Italy ($800M), China ($761M) and France ($744M) constituted the largest markets for pork exported from Spain worldwide, with a combined 33% share of total exports. Japan, Poland, Romania, South Korea and Portugal lagged somewhat behind, together accounting for a further 34%.
Among the main countries of destination, Romania, with a CAGR of +27.9%, recorded the highest rates of growth with regard to the value of exports, over the period under review, while shipments for the other leaders experienced more modest paces of growth.
Exports by Type
Frozen pig meat other than cuts or carcases (830K tons), fresh or chilled pig meat other than cuts or carcases (702K tons) and fresh or chilled hams, shoulders and cuts of pig meat (228K tons) were the main products of pork exports from Spain, together comprising 92% of total exports. Frozen hams, shoulders and cuts of pig meat, fresh or chilled carcases of pig meat and frozen carcases of pig meat lagged somewhat behind, together accounting for a further 8.4%.
From 2013 to 2023, the most notable rate of growth in terms of shipments, amongst the major product types, was attained by frozen hams, shoulders and cuts of pig meat (with a CAGR of +10.9%), while the other products experienced more modest paces of growth.
In value terms, frozen pig meat other than cuts or carcases ($3B), fresh or chilled pig meat other than cuts or carcases ($2.9B) and fresh or chilled hams, shoulders and cuts of pig meat ($743M) appeared to be the most exported types of pork from Spain worldwide, together comprising 94% of total exports.
Frozen pig meat other than cuts or carcases, with a CAGR of +11.1%, recorded the highest growth rate of the value of exports, among the main product categories over the period under review, while shipments for the other products experienced more modest paces of growth.
Export Prices by Country
In 2023, the pork price stood at $3,669 per ton (FOB, Spain), with an increase of 24% against the previous year. Over the last decade, it increased at an average annual rate of +1.5%. As a result, the export price reached the peak level and is likely to continue growth in the immediate term.
There were significant differences in the average prices for the major foreign markets. In 2023, amid the top suppliers, the country with the highest price was Portugal ($4,420 per ton), while the average price for exports to China ($2,578 per ton) was amongst the lowest.
From 2013 to 2023, the most notable rate of growth in terms of prices was recorded for supplies to South Korea (+4.8%), while the prices for the other major destinations experienced more modest paces of growth.
This report provides an in-depth analysis of the pork market in Spain. Within it, you will discover the latest data on market trends and opportunities by country, consumption, production and price developments, as well as the global trade (imports and exports). The forecast exhibits the market prospects through 2030.
Product coverage:
- FCL 1035 - Pig meat
Country coverage:
- Spain
Data coverage:
- Market volume and value
- Per Capita consumption
- Forecast of the market dynamics in the medium term
- Trade (exports and imports) in Spain
- Export and import prices
- Market trends, drivers and restraints
- Key market players and their profiles
Reasons to buy this report:
- Take advantage of the latest data
- Find deeper insights into current market developments
- Discover vital success factors affecting the market
This report is designed for manufacturers, distributors, importers, and wholesalers, as well as for investors, consultants and advisors.
In this report, you can find information that helps you to make informed decisions on the following issues:
- How to diversify your business and benefit from new market opportunities
- How to load your idle production capacity
- How to boost your sales on overseas markets
- How to increase your profit margins
- How to make your supply chain more sustainable
- How to reduce your production and supply chain costs
- How to outsource production to other countries
- How to prepare your business for global expansion
While doing this research, we combine the accumulated expertise of our analysts and the capabilities of artificial intelligence. The AI-based platform, developed by our data scientists, constitutes the key working tool for business analysts, empowering them to discover deep insights and ideas from the marketing data.
-
1. INTRODUCTION
Making Data-Driven Decisions to Grow Your Business
- REPORT DESCRIPTION
- RESEARCH METHODOLOGY AND AI PLATFORM
- DATA-DRIVEN DECISIONS FOR YOUR BUSINESS
- GLOSSARY AND SPECIFIC TERMS
-
2. EXECUTIVE SUMMARY
A Quick Overview of Market Performance
- KEY FINDINGS
- MARKET TRENDS This Chapter is Available Only for the Professional Edition PRO
-
3. MARKET OVERVIEW
Understanding the Current State of The Market and Its Prospects
- MARKET SIZE
- MARKET STRUCTURE
- TRADE BALANCE
- PER CAPITA CONSUMPTION
- MARKET FORECAST TO 2030
-
4. MOST PROMISING PRODUCT
Finding New Products to Diversify Your Business
This Chapter is Available Only for the Professional Edition PRO- TOP PRODUCTS TO DIVERSIFY YOUR BUSINESS
- BEST-SELLING PRODUCTS
- MOST CONSUMED PRODUCT
- MOST TRADED PRODUCT
- MOST PROFITABLE PRODUCT FOR EXPORT
-
5. MOST PROMISING SUPPLYING COUNTRIES
Choosing the Best Countries to Establish Your Sustainable Supply Chain
This Chapter is Available Only for the Professional Edition PRO- TOP COUNTRIES TO SOURCE YOUR PRODUCT
- TOP PRODUCING COUNTRIES
- COUNTRIES WITH TOP YIELDS
- TOP EXPORTING COUNTRIES
- LOW-COST EXPORTING COUNTRIES
-
6. MOST PROMISING OVERSEAS MARKETS
Choosing the Best Countries to Boost Your Exports
This Chapter is Available Only for the Professional Edition PRO- TOP OVERSEAS MARKETS FOR EXPORTING YOUR PRODUCT
- TOP CONSUMING MARKETS
- UNSATURATED MARKETS
- TOP IMPORTING MARKETS
- MOST PROFITABLE MARKETS
7. PRODUCTION
The Latest Trends and Insights into The Industry
- PRODUCTION, PRODUCING ANIMALS AND YIELD
8. IMPORTS
The Largest Import Supplying Countries
- IMPORTS FROM 2012–2023
- IMPORTS BY COUNTRY
- IMPORT PRICES BY COUNTRY
9. EXPORTS
The Largest Destinations for Exports
- EXPORTS FROM 2012–2023
- EXPORTS BY COUNTRY
- EXPORT PRICES BY COUNTRY
-
10. PROFILES OF MAJOR PRODUCERS
The Largest Producers on The Market and Their Profiles
This Chapter is Available Only for the Professional Edition PRO -
LIST OF TABLES
- Key Findings In 2023
- Market Volume, In Physical Terms, 2012–2023
- Market Value, 2012–2023
- Per Capita Consumption In 2012-2023
- Imports, In Physical Terms, By Country, 2012–2023
- Imports, In Value Terms, By Country, 2012–2023
- Import Prices, By Country Of Origin, 2012–2023
- Exports, In Physical Terms, By Country, 2012–2023
- Exports, In Value Terms, By Country, 2012–2023
- Export Prices, By Country Of Destination, 2012–2023
-
LIST OF FIGURES
- Market Volume, In Physical Terms, 2012–2023
- Market Value, 2012–2023
- Market Structure – Domestic Supply vs. Imports, In Physical Terms, 2012-2023
- Market Structure – Domestic Supply vs. Imports, In Value Terms, 2012-2023
- Trade Balance, In Physical Terms, 2012-2023
- Trade Balance, In Value Terms, 2012-2023
- Per Capita Consumption, 2012-2023
- Market Volume Forecast to 2030
- Market Value Forecast to 2030
- Products: Market Size And Growth, By Type
- Products: Average Per Capita Consumption, By Type
- Products: Exports And Growth, By Type
- Products: Export Prices And Growth, By Type
- Production Volume And Growth
- Yield And Growth
- Exports And Growth
- Export Prices And Growth
- Market Size And Growth
- Per Capita Consumption
- Imports And Growth
- Import Prices
- Production, In Physical Terms, 2012–2023
- Production, In Value Terms, 2012–2023
- Producing Animals Slaughtered, 2012–2023
- Yield, 2012–2023
- Imports, In Physical Terms, 2012–2023
- Imports, In Value Terms, 2012–2023
- Imports, In Physical Terms, By Country, 2023
- Imports, In Physical Terms, By Country, 2012–2023
- Imports, In Value Terms, By Country, 2012–2023
- Import Prices, By Country Of Origin, 2012–2023
- Exports, In Physical Terms, 2012–2023
- Exports, In Value Terms, 2012–2023
- Exports, In Physical Terms, By Country, 2023
- Exports, In Physical Terms, By Country, 2012–2023
- Exports, In Value Terms, By Country, 2012–2023
- Export Prices, By Country Of Destination, 2012–2023


