
U.S. - Pulses - Market Analysis, Forecast, Size, Trends and Insights
Get instant access to more than 2 million reports, dashboards, and datasets on the IndexBox Platform.
View PricingPulses Price per Ton May 2022
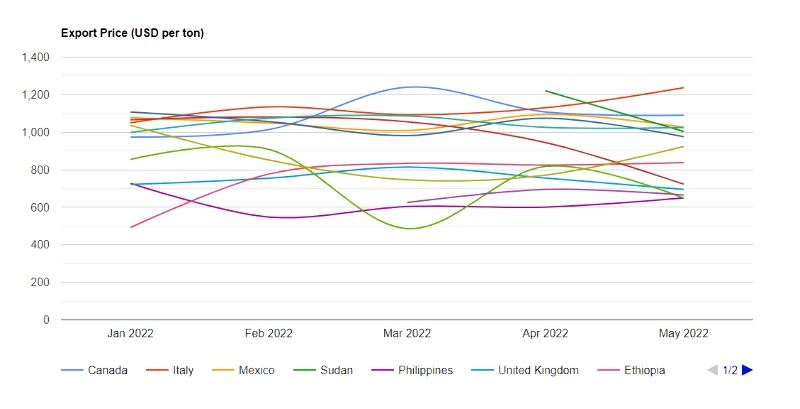
U.S. Pulses Price per Ton May 2022
The pulses price per ton stood at $1,025 (FOB, US) in May 2022, remaining stable against the previous month. In general, the export price, however, recorded a relatively flat trend pattern. The pace of growth appeared the most rapid in Feb 2022 when the average export price increased by 7.6% against the previous month. Over the period under review, the average export prices attained the maximum at $1,087 per ton in Mar 2022; however, from Apr 2022 to May 2022, the export prices stood at a somewhat lower figure.
Prices varied noticeably by the country of destination: the country with the highest price was Italy ($1,237 per ton), while the average price for exports to China ($649 per ton) was amongst the lowest.
From Jan 2022 to May 2022, the most notable rate of growth in terms of prices was recorded for supplies to Ethiopia (+14.2%), while the prices for the other major destinations experienced more modest paces of growth.
U.S. Pulses Exports
In May 2022, overseas shipments of pulses decreased by -9.1% to 66K tons for the first time since Feb 2022, thus ending a two-month rising trend. In general, total exports indicated a prominent expansion from Jan 2022 to May 2022: its volume increased at an average monthly rate of +7.3% over the last four months. The trend pattern, however, indicated some noticeable fluctuations being recorded throughout the analyzed period. Based on May 2022 figures, exports increased by +35.2% against Feb 2022 indices. The most prominent rate of growth was recorded in Mar 2022 with an increase of 26% m-o-m. The exports peaked at 72K tons in Apr 2022; however, from May 2022 to May 2022, the exports remained at a lower figure.
In value terms, pulses exports fell to $67M (IndexBox estimates) in May 2022. Over the period under review, total exports indicated a strong increase from Jan 2022 to May 2022: its value increased at an average monthly rate of +7.3% over the last four - month period. The trend pattern, however, indicated some noticeable fluctuations being recorded throughout the analyzed period. Based on May 2022 figures, exports increased by +36.3% against Jan 2022 indices. The pace of growth appeared the most rapid in Mar 2022 with an increase of 27% against the previous month. The exports peaked at $74M in Apr 2022; however, from May 2022 to May 2022, the exports failed to regain momentum.
U.S. Pulses Exports by Country
Canada (14K tons), Sudan (9K tons) and Mexico (8.4K tons) were the main destinations of pulses exports from the United States, with a combined 48% share of total exports.
From Jan 2022 to May 2022, the most notable rate of growth in terms of shipments, amongst the main countries of destination, was attained by Sudan, while the other leaders experienced more modest paces of growth.
In value terms, Canada ($16M), Italy ($9.2M) and Sudan ($9M) appeared to be the largest markets for pulses exported from the United States worldwide, with a combined 50% share of total exports.
Among the main countries of destination, Sudan saw the highest growth rate of the value of exports, over the period under review, while shipments for the other leaders experienced more modest paces of growth.
Join Us at HANNOVER MESSE 2024
Don’t miss your chance to connect with us directly. Schedule a personal meeting to dive deeper into how solutions.
Hall 002, Stand C10. 22 - 26 April 2024 | Hannover, Germany

This report provides an in-depth analysis of the pulses market in the U.S.. Within it, you will discover the latest data on market trends and opportunities by country, consumption, production and price developments, as well as the global trade (imports and exports). The forecast exhibits the market prospects through 2030.
Product coverage:
- FCL 203 - Bambara beans
- FCL 176 - Beans, dry
- FCL 181 - Broad beans, dry
- FCL 191 - Chick-peas, dry
- FCL 195 - Cow peas, dry
- FCL 201 - Lentils, dry
- FCL 187 - Peas, dry
- FCL 197 - Pigeon peas
- FCL 211 - Pulses nes
Country coverage:
- United States
Data coverage:
- Market volume and value
- Per Capita consumption
- Forecast of the market dynamics in the medium term
- Trade (exports and imports) in the U.S.
- Export and import prices
- Market trends, drivers and restraints
- Key market players and their profiles
Reasons to buy this report:
- Take advantage of the latest data
- Find deeper insights into current market developments
- Discover vital success factors affecting the market
This report is designed for manufacturers, distributors, importers, and wholesalers, as well as for investors, consultants and advisors.
In this report, you can find information that helps you to make informed decisions on the following issues:
- How to diversify your business and benefit from new market opportunities
- How to load your idle production capacity
- How to boost your sales on overseas markets
- How to increase your profit margins
- How to make your supply chain more sustainable
- How to reduce your production and supply chain costs
- How to outsource production to other countries
- How to prepare your business for global expansion
While doing this research, we combine the accumulated expertise of our analysts and the capabilities of artificial intelligence. The AI-based platform, developed by our data scientists, constitutes the key working tool for business analysts, empowering them to discover deep insights and ideas from the marketing data.
-
1. INTRODUCTION
Making Data-Driven Decisions to Grow Your Business
- REPORT DESCRIPTION
- RESEARCH METHODOLOGY AND AI PLATFORM
- DATA-DRIVEN DECISIONS FOR YOUR BUSINESS
- GLOSSARY AND SPECIFIC TERMS
-
2. EXECUTIVE SUMMARY
A Quick Overview of Market Performance
- KEY FINDINGS
- MARKET TRENDS This Chapter is Available Only for the Professional Edition PRO
-
3. MARKET OVERVIEW
Understanding the Current State of The Market and Its Prospects
- MARKET SIZE
- MARKET STRUCTURE
- TRADE BALANCE
- PER CAPITA CONSUMPTION
- MARKET FORECAST TO 2030
-
4. MOST PROMISING PRODUCT
Finding New Products to Diversify Your Business
This Chapter is Available Only for the Professional Edition PRO- TOP PRODUCTS TO DIVERSIFY YOUR BUSINESS
- BEST-SELLING PRODUCTS
- MOST CONSUMED PRODUCT
- MOST TRADED PRODUCT
- MOST PROFITABLE PRODUCT FOR EXPORT
-
5. MOST PROMISING SUPPLYING COUNTRIES
Choosing the Best Countries to Establish Your Sustainable Supply Chain
This Chapter is Available Only for the Professional Edition PRO- TOP COUNTRIES TO SOURCE YOUR PRODUCT
- TOP PRODUCING COUNTRIES
- COUNTRIES WITH TOP YIELDS
- TOP EXPORTING COUNTRIES
- LOW-COST EXPORTING COUNTRIES
-
6. MOST PROMISING OVERSEAS MARKETS
Choosing the Best Countries to Boost Your Exports
This Chapter is Available Only for the Professional Edition PRO- TOP OVERSEAS MARKETS FOR EXPORTING YOUR PRODUCT
- TOP CONSUMING MARKETS
- UNSATURATED MARKETS
- TOP IMPORTING MARKETS
- MOST PROFITABLE MARKETS
7. PRODUCTION
The Latest Trends and Insights into The Industry
- PRODUCTION, HARVESTED AREA AND YIELD
8. IMPORTS
The Largest Import Supplying Countries
- IMPORTS FROM 2012–2023
- IMPORTS BY COUNTRY
- IMPORT PRICES BY COUNTRY
9. EXPORTS
The Largest Destinations for Exports
- EXPORTS FROM 2012–2023
- EXPORTS BY COUNTRY
- EXPORT PRICES BY COUNTRY
-
10. PROFILES OF MAJOR PRODUCERS
The Largest Producers on The Market and Their Profiles
This Chapter is Available Only for the Professional Edition PRO -
LIST OF TABLES
- Key Findings In 2023
- Market Volume, In Physical Terms, 2012–2023
- Market Value, 2012–2023
- Per Capita Consumption In 2012-2023
- Imports, In Physical Terms, By Country, 2012–2023
- Imports, In Value Terms, By Country, 2012–2023
- Import Prices, By Country Of Origin, 2012–2023
- Exports, In Physical Terms, By Country, 2012–2023
- Exports, In Value Terms, By Country, 2012–2023
- Export Prices, By Country Of Destination, 2012–2023
-
LIST OF FIGURES
- Market Volume, In Physical Terms, 2012–2023
- Market Value, 2012–2023
- Market Structure – Domestic Supply vs. Imports, In Physical Terms, 2012-2023
- Market Structure – Domestic Supply vs. Imports, In Value Terms, 2012-2023
- Trade Balance, In Physical Terms, 2012-2023
- Trade Balance, In Value Terms, 2012-2023
- Per Capita Consumption, 2012-2023
- Market Volume Forecast to 2030
- Market Value Forecast to 2030
- Products: Market Size And Growth, By Type
- Products: Average Per Capita Consumption, By Type
- Products: Exports And Growth, By Type
- Products: Export Prices And Growth, By Type
- Production Volume And Growth
- Yield And Growth
- Exports And Growth
- Export Prices And Growth
- Market Size And Growth
- Per Capita Consumption
- Imports And Growth
- Import Prices
- Production, In Physical Terms, 2012–2023
- Production, In Value Terms, 2012–2023
- Area Harvested, 2012–2023
- Yield, 2012–2023
- Imports, In Physical Terms, 2012–2023
- Imports, In Value Terms, 2012–2023
- Imports, In Physical Terms, By Country, 2023
- Imports, In Physical Terms, By Country, 2012–2023
- Imports, In Value Terms, By Country, 2012–2023
- Import Prices, By Country Of Origin, 2012–2023
- Exports, In Physical Terms, 2012–2023
- Exports, In Value Terms, 2012–2023
- Exports, In Physical Terms, By Country, 2023
- Exports, In Physical Terms, By Country, 2012–2023
- Exports, In Value Terms, By Country, 2012–2023
- Export Prices, By Country Of Destination, 2012–2023


