
World - Common Pottery - Market Analysis, Forecast, Size, Trends And Insights
Get instant access to more than 2 million reports, dashboards, and datasets on the IndexBox Platform.
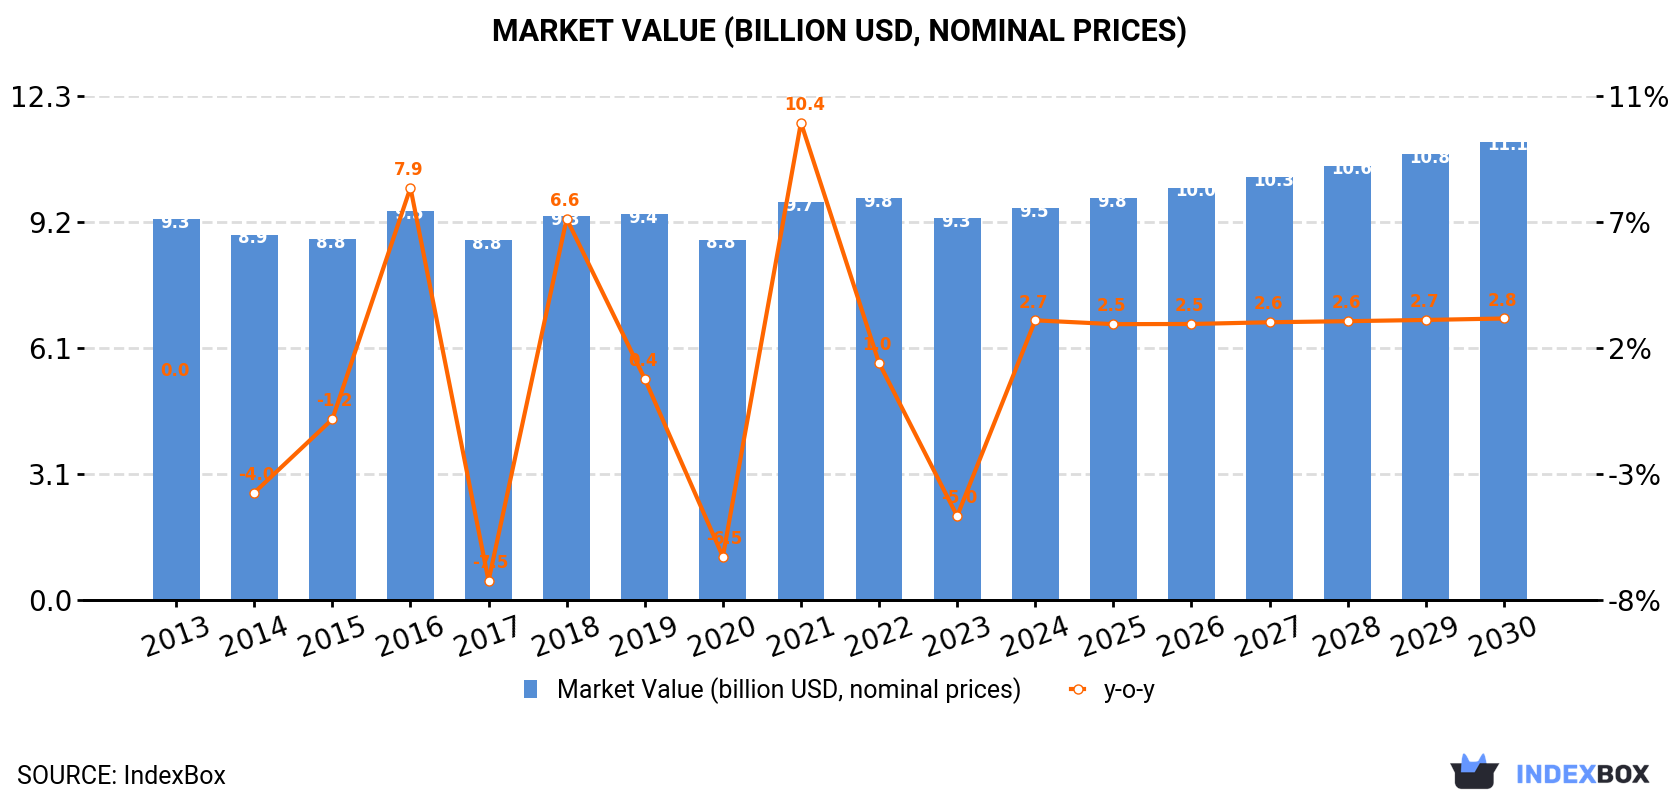
View PricingGlobal Pottery Market Set to See Moderate Growth with CAGR of +0.7% by 2030, Reaching $11.1B
IndexBox has just published a new report: World - Common Pottery - Market Analysis, Forecast, Size, Trends And Insights.The common pottery market is forecasted to have a slight increase in volume and value from 2023 to 2030, with China leading in consumption and production. The United States is the major importer, while China, Portugal, and the Netherlands are key exporters. Export prices have been on a gradual rise over the last decade.
Market Forecast
Market Forecast
Driven by rising demand for common pottery worldwide, the market is expected to start an upward consumption trend over the next seven-year period. The performance of the market is forecast to increase slightly, with an anticipated CAGR of +0.7% for the period from 2023 to 2030, which is projected to bring the market volume to 3.4M tons by the end of 2030.
In value terms, the market is forecast to increase with an anticipated CAGR of +2.6% for the period from 2023 to 2030, which is projected to bring the market value to $11.1B (in nominal prices) by the end of 2030.
Consumption
Consumption
In 2023, global common pottery consumption reduced to 3.2M tons, with a decrease of -2.8% on the previous year. In general, consumption recorded a relatively flat trend pattern. The growth pace was the most rapid in 2021 with an increase of 9% against the previous year. As a result, consumption reached the peak volume of 3.4M tons. From 2022 to 2023, the growth of the global consumption remained at a lower figure.
The global common pottery market revenue contracted modestly to $9.3B in 2023, dropping by -5% against the previous year. This figure reflects the total revenues of producers and importers (excluding logistics costs, retail marketing costs, and retailers' margins, which will be included in the final consumer price). Over the period under review, consumption, however, recorded a relatively flat trend pattern. Over the period under review, the global market hit record highs at $9.8B in 2022, and then contracted in the following year.
Consumption By Country
China (852K tons) remains the largest common pottery consuming country worldwide, comprising approx. 26% of total volume. Moreover, common pottery consumption in China exceeded the figures recorded by the second-largest consumer, the United States (387K tons), twofold. India (297K tons) ranked third in terms of total consumption with a 9.2% share.
From 2013 to 2023, the average annual rate of growth in terms of volume in China was relatively modest. The remaining consuming countries recorded the following average annual rates of consumption growth: the United States (+2.0% per year) and India (+0.9% per year).
In value terms, China ($2.3B) led the market, alone. The second position in the ranking was held by the United States ($1.1B). It was followed by India.
In China, the common pottery market remained relatively stable over the period from 2013-2023. In the other countries, the average annual rates were as follows: the United States (+0.5% per year) and India (+1.3% per year).
In 2023, the highest levels of common pottery per capita consumption was registered in Portugal (7.1 kg per person), followed by the United States (1.1 kg per person), the UK (1 kg per person) and Turkey (0.7 kg per person), while the world average per capita consumption of common pottery was estimated at 0.4 kg per person.
In Portugal, common pottery per capita consumption plunged by an average annual rate of -1.2% over the period from 2013-2023. The remaining consuming countries recorded the following average annual rates of per capita consumption growth: the United States (+1.3% per year) and the UK (-0.8% per year).
Production
Production
In 2023, approx. 2.6M tons of common pottery were produced worldwide; flattening at the year before. Over the period under review, production, however, showed a relatively flat trend pattern. The pace of growth appeared the most rapid in 2018 when the production volume increased by 3.4% against the previous year. Global production peaked at 2.7M tons in 2019; however, from 2020 to 2023, production stood at a somewhat lower figure.
In value terms, common pottery production reached $7.7B in 2023 estimated in export price. Overall, production showed a relatively flat trend pattern. The pace of growth was the most pronounced in 2016 when the production volume increased by 13%. As a result, production attained the peak level of $8.2B. From 2017 to 2023, global production growth remained at a somewhat lower figure.
Production By Country
The country with the largest volume of common pottery production was China (1M tons), accounting for 39% of total volume. Moreover, common pottery production in China exceeded the figures recorded by the second-largest producer, India (305K tons), threefold. Portugal (154K tons) ranked third in terms of total production with a 6% share.
From 2013 to 2023, the average annual growth rate of volume in China was relatively modest. The remaining producing countries recorded the following average annual rates of production growth: India (+1.4% per year) and Portugal (+1.2% per year).
Imports
Imports
Global common pottery imports declined to 1.3M tons in 2023, with a decrease of -12.9% on 2022. The total import volume increased at an average annual rate of +1.8% from 2013 to 2023; however, the trend pattern indicated some noticeable fluctuations being recorded in certain years. The pace of growth appeared the most rapid in 2021 with an increase of 29% against the previous year. As a result, imports attained the peak of 1.5M tons. From 2022 to 2023, the growth of global imports remained at a lower figure.
In value terms, common pottery imports reduced remarkably to $3.6B in 2023. The total import value increased at an average annual rate of +2.7% from 2013 to 2023; however, the trend pattern indicated some noticeable fluctuations being recorded in certain years. The growth pace was the most rapid in 2021 when imports increased by 36%. Global imports peaked at $4.4B in 2022, and then fell sharply in the following year.
Imports By Country
The United States represented the major importer of common pottery in the world, with the volume of imports accounting for 383K tons, which was near 31% of total imports in 2023. It was distantly followed by Germany (71K tons), the UK (62K tons) and France (58K tons), together mixing up a 15% share of total imports. The following importers - the Netherlands (51K tons), Canada (33K tons), Italy (31K tons), Mexico (30K tons), Spain (30K tons), South Africa (30K tons), Belgium (24K tons) and Poland (24K tons) - together made up 20% of total imports.
From 2013 to 2023, average annual rates of growth with regard to common pottery imports into the United States stood at +3.2%. At the same time, the Netherlands (+8.2%), Belgium (+7.9%), Mexico (+6.6%), Poland (+4.5%), Spain (+4.1%), Germany (+3.9%), Italy (+2.5%), South Africa (+1.8%) and France (+1.1%) displayed positive paces of growth. Moreover, the Netherlands emerged as the fastest-growing importer imported in the world, with a CAGR of +8.2% from 2013-2023. The UK experienced a relatively flat trend pattern. By contrast, Canada (-2.5%) illustrated a downward trend over the same period. From 2013 to 2023, the share of the United States and the Netherlands increased by +4.1 and +1.9 percentage points, while the shares of the other countries remained relatively stable throughout the analyzed period.
In value terms, the United States ($1B) constitutes the largest market for imported common pottery worldwide, comprising 28% of global imports. The second position in the ranking was held by Germany ($266M), with a 7.3% share of global imports. It was followed by France, with a 5.3% share.
From 2013 to 2023, the average annual rate of growth in terms of value in the United States amounted to +1.0%. The remaining importing countries recorded the following average annual rates of imports growth: Germany (+5.9% per year) and France (+3.3% per year).
Import Prices By Country
In 2023, the average common pottery import price amounted to $2,913 per ton, with a decrease of -4.1% against the previous year. In general, the import price, however, continues to indicate a relatively flat trend pattern. The most prominent rate of growth was recorded in 2018 an increase of 12% against the previous year. Global import price peaked at $3,037 per ton in 2022, and then dropped modestly in the following year.
Prices varied noticeably by country of destination: amid the top importers, the country with the highest price was Canada ($4,393 per ton), while South Africa ($711 per ton) was amongst the lowest.
From 2013 to 2023, the most notable rate of growth in terms of prices was attained by Poland (+4.6%), while the other global leaders experienced more modest paces of growth.
Exports
Exports
In 2023, overseas shipments of common pottery decreased by -11.7% to 597K tons, falling for the second consecutive year after two years of growth. The total export volume increased at an average annual rate of +2.5% from 2013 to 2023; however, the trend pattern indicated some noticeable fluctuations being recorded throughout the analyzed period. The pace of growth appeared the most rapid in 2021 when exports increased by 23%. As a result, the exports attained the peak of 697K tons. From 2022 to 2023, the growth of the global exports remained at a somewhat lower figure.
In value terms, common pottery exports reduced to $2.4B in 2023. In general, total exports indicated a temperate expansion from 2013 to 2023: its value increased at an average annual rate of +4.9% over the last decade. The trend pattern, however, indicated some noticeable fluctuations being recorded throughout the analyzed period. Based on 2023 figures, exports decreased by -8.1% against 2021 indices. The growth pace was the most rapid in 2021 when exports increased by 31% against the previous year. As a result, the exports reached the peak of $2.6B. From 2022 to 2023, the growth of the global exports remained at a somewhat lower figure.
Exports By Country
In 2023, China (159K tons), distantly followed by Portugal (86K tons), the Netherlands (56K tons) and Thailand (30K tons) represented the key exporters of common pottery, together comprising 55% of total exports. The following exporters - Germany (20K tons), Italy (19K tons), Turkey (18K tons), Romania (17K tons), India (16K tons), Spain (15K tons), Japan (13K tons), Poland (13K tons) and Mexico (13K tons) - together made up 24% of total exports.
From 2013 to 2023, the biggest increases were recorded for the Netherlands (with a CAGR of +19.3%), while shipments for the other global leaders experienced more modest paces of growth.
In value terms, China ($521M), Portugal ($274M) and the Netherlands ($191M) appeared to be the countries with the highest levels of exports in 2023, together comprising 41% of global exports. Thailand, Germany, Poland, Italy, Japan, Spain, Turkey, Romania, Mexico and India lagged somewhat behind, together comprising a further 30%.
India, with a CAGR of +19.1%, recorded the highest growth rate of the value of exports, among the main exporting countries over the period under review, while shipments for the other global leaders experienced more modest paces of growth.
Export Prices By Country
The average common pottery export price stood at $4,023 per ton in 2023, surging by 4.3% against the previous year. Over the last decade, it increased at an average annual rate of +2.3%. The pace of growth appeared the most rapid in 2016 an increase of 21% against the previous year. Over the period under review, the average export prices attained the maximum in 2023 and is likely to see gradual growth in years to come.
Prices varied noticeably by country of origin: amid the top suppliers, the country with the highest price was Poland ($8,464 per ton), while India ($1,926 per ton) was amongst the lowest.
From 2013 to 2023, the most notable rate of growth in terms of prices was attained by Poland (+5.3%), while the other global leaders experienced more modest paces of growth.
This report provides an in-depth analysis of the global common pottery market. Within it, you will discover the latest data on market trends and opportunities by country, consumption, production and price developments, as well as the global trade (imports and exports). The forecast exhibits the market prospects through 2030.
Product coverage:
- Prodcom 23411210 - Ceramic tableware, other household articles : common pottery
- Prodcom 23411230 - Ceramic tableware, other household articles : stoneware
- Prodcom 23411250 - Ceramic tableware, other household articles : earthenware or fine pottery
- Prodcom 23411290 - Ceramic tableware, other household articles : others
Country coverage:
Worldwide - the report contains statistical data for 200 countries and includes detailed profiles of the 50 largest consuming countries:
- USA
- China
- Japan
- Germany
- United Kingdom
- France
- Brazil
- Italy
- Russian Federation
- India
- Canada
- Australia
- Republic of Korea
- Spain
- Mexico
- Indonesia
- Netherlands
- Turkey
- Saudi Arabia
- Switzerland
- Sweden
- Nigeria
- Poland
- Belgium
- Argentina
- Norway
- Austria
- Thailand
- United Arab Emirates
- Colombia
- Denmark
- South Africa
- Malaysia
- Israel
- Singapore
- Egypt
- Philippines
- Finland
- Chile
- Ireland
- Pakistan
- Greece
- Portugal
- Kazakhstan
- Algeria
- Czech Republic
- Qatar
- Peru
- Romania
- Vietnam
+ the largest producing countries
Data coverage:
- Global market volume and value
- Per Capita consumption
- Forecast of the market dynamics in the medium term
- Global production, split by region and country
- Global trade (exports and imports)
- Export and import prices
- Market trends, drivers and restraints
- Key market players and their profiles
Reasons to buy this report:
- Take advantage of the latest data
- Find deeper insights into current market developments
- Discover vital success factors affecting the market
This report is designed for manufacturers, distributors, importers, and wholesalers, as well as for investors, consultants and advisors.
In this report, you can find information that helps you to make informed decisions on the following issues:
- How to diversify your business and benefit from new market opportunities
- How to load your idle production capacity
- How to boost your sales on overseas markets
- How to increase your profit margins
- How to make your supply chain more sustainable
- How to reduce your production and supply chain costs
- How to outsource production to other countries
- How to prepare your business for global expansion
While doing this research, we combine the accumulated expertise of our analysts and the capabilities of artificial intelligence. The AI-based platform, developed by our data scientists, constitutes the key working tool for business analysts, empowering them to discover deep insights and ideas from the marketing data.
-
1. INTRODUCTION
Making Data-Driven Decisions to Grow Your Business
- REPORT DESCRIPTION
- RESEARCH METHODOLOGY AND AI PLATFORM
- DATA-DRIVEN DECISIONS FOR YOUR BUSINESS
- GLOSSARY AND SPECIFIC TERMS
-
2. EXECUTIVE SUMMARY
A Quick Overview of Market Performance
- KEY FINDINGS
- MARKET TRENDS This Chapter is Available Only for the Professional Edition PRO
-
3. MARKET OVERVIEW
Understanding the Current State of The Market and Its Prospects
- MARKET SIZE
- CONSUMPTION BY COUNTRY
- MARKET FORECAST TO 2030
-
4. MOST PROMISING PRODUCT
Finding New Products to Diversify Your Business
This Chapter is Available Only for the Professional Edition PRO- TOP PRODUCTS TO DIVERSIFY YOUR BUSINESS
- BEST-SELLING PRODUCTS
- MOST CONSUMED PRODUCT
- MOST TRADED PRODUCT
- MOST PROFITABLE PRODUCT FOR EXPORT
-
5. MOST PROMISING SUPPLYING COUNTRIES
Choosing the Best Countries to Establish Your Sustainable Supply Chain
This Chapter is Available Only for the Professional Edition PRO- TOP COUNTRIES TO SOURCE YOUR PRODUCT
- TOP PRODUCING COUNTRIES
- TOP EXPORTING COUNTRIES
- LOW-COST EXPORTING COUNTRIES
-
6. MOST PROMISING OVERSEAS MARKETS
Choosing the Best Countries to Boost Your Exports
This Chapter is Available Only for the Professional Edition PRO- TOP OVERSEAS MARKETS FOR EXPORTING YOUR PRODUCT
- TOP CONSUMING MARKETS
- UNSATURATED MARKETS
- TOP IMPORTING MARKETS
- MOST PROFITABLE MARKETS
7. GLOBAL PRODUCTION
The Latest Trends and Insights into The Industry
- PRODUCTION VOLUME AND VALUE
- PRODUCTION BY COUNTRY
8. GLOBAL IMPORTS
The Largest Importers on The Market and How They Succeed
- IMPORTS FROM 2012–2023
- IMPORTS BY COUNTRY
- IMPORT PRICES BY COUNTRY
9. GLOBAL EXPORTS
The Largest Exporters on The Market and How They Succeed
- EXPORTS FROM 2012–2023
- EXPORTS BY COUNTRY
- EXPORT PRICES BY COUNTRY
-
10. PROFILES OF MAJOR PRODUCERS
The Largest Producers on The Market and Their Profiles
This Chapter is Available Only for the Professional Edition PRO -
11. COUNTRY PROFILES
The Largest Markets And Their Profiles
This Chapter is Available Only for the Professional Edition PRO- United States
- China
- Japan
- Germany
- United Kingdom
- France
- Brazil
- Italy
- Russian Federation
- India
- Canada
- Australia
- Republic of Korea
- Spain
- Mexico
- Indonesia
- Netherlands
- Turkey
- Saudi Arabia
- Switzerland
- Sweden
- Nigeria
- Poland
- Belgium
- Argentina
- Norway
- Austria
- Thailand
- United Arab Emirates
- Colombia
- Denmark
- South Africa
- Malaysia
- Israel
- Singapore
- Egypt
- Philippines
- Finland
- Chile
- Ireland
- Pakistan
- Greece
- Portugal
- Kazakhstan
- Algeria
- Czech Republic
- Qatar
- Peru
- Romania
- Vietnam
-
LIST OF TABLES
- Key Findings In 2023
- Market Volume, In Physical Terms, 2012–2023
- Market Value, 2012–2023
- Per Capita Consumption, By Country, 2018–2023
- Production, In Physical Terms, By Country, 2012–2023
- Imports, In Physical Terms, By Country, 2012–2023
- Imports, In Value Terms, By Country, 2012–2023
- Import Prices, By Country Of Destination, 2012–2023
- Exports, In Physical Terms, By Country, 2012–2023
- Exports, In Value Terms, By Country, 2012–2023
- Export Prices, By Country Of Origin, 2012–2023
-
LIST OF FIGURES
- Market Volume, In Physical Terms, 2012–2023
- Market Value, 2012–2023
- Consumption, By Country, 2023
- Market Volume Forecast to 2030
- Market Value Forecast to 2030
- Products: Market Size And Growth, By Type
- Products: Average Per Capita Consumption, By Type
- Products: Exports And Growth, By Type
- Products: Export Prices And Growth, By Type
- Production Volume And Growth
- Exports And Growth
- Export Prices And Growth
- Market Size And Growth
- Per Capita Consumption
- Imports And Growth
- Import Prices
- Production, In Physical Terms, 2012–2023
- Production, In Value Terms, 2012–2023
- Production, By Country, 2023
- Production, In Physical Terms, By Country, 2012–2023
- Imports, In Physical Terms, 2012–2023
- Imports, In Value Terms, 2012–2023
- Imports, In Physical Terms, By Country, 2023
- Imports, In Physical Terms, By Country, 2012–2023
- Imports, In Value Terms, By Country, 2012–2023
- Import Prices, By Country, 2012–2023
- Exports, In Physical Terms, 2012–2023
- Exports, In Value Terms, 2012–2023
- Exports, In Physical Terms, By Country, 2023
- Exports, In Physical Terms, By Country, 2012–2023
- Exports, In Value Terms, By Country, 2012–2023
- Export Prices, 2012–2023


