World - Animal And Pet Feed - Market Analysis, Forecast, Size, Trends And Insights
Get instant access to more than 2 million reports, dashboards, and datasets on the IndexBox Platform.
View PricingGlobal Animal and Pet Feed Market to Witness 2.2% CAGR Growth from 2023 to 2030
IndexBox has just published a new report: World - Animal And Pet Feed - Market Analysis, Forecast, Size, Trends And Insights.
The article provides in-depth analysis of the global animal and pet feed market, highlighting trends from 2013 to 2023 and projections for 2023 to 2030. Key points include the expected CAGR, market volume, and value, along with insights on consumption, production, imports, and exports. The data also covers the top consuming, producing, importing, and exporting countries, as well as average prices and growth rates in the industry.
Market Forecast
Driven by increasing demand for animal and pet feed worldwide, the market is expected to continue an upward consumption trend over the next seven-year period. Market performance is forecast to retain its current trend pattern, expanding with an anticipated CAGR of +2.2% for the period from 2023 to 2030, which is projected to bring the market volume to 1,187M tons by the end of 2030.
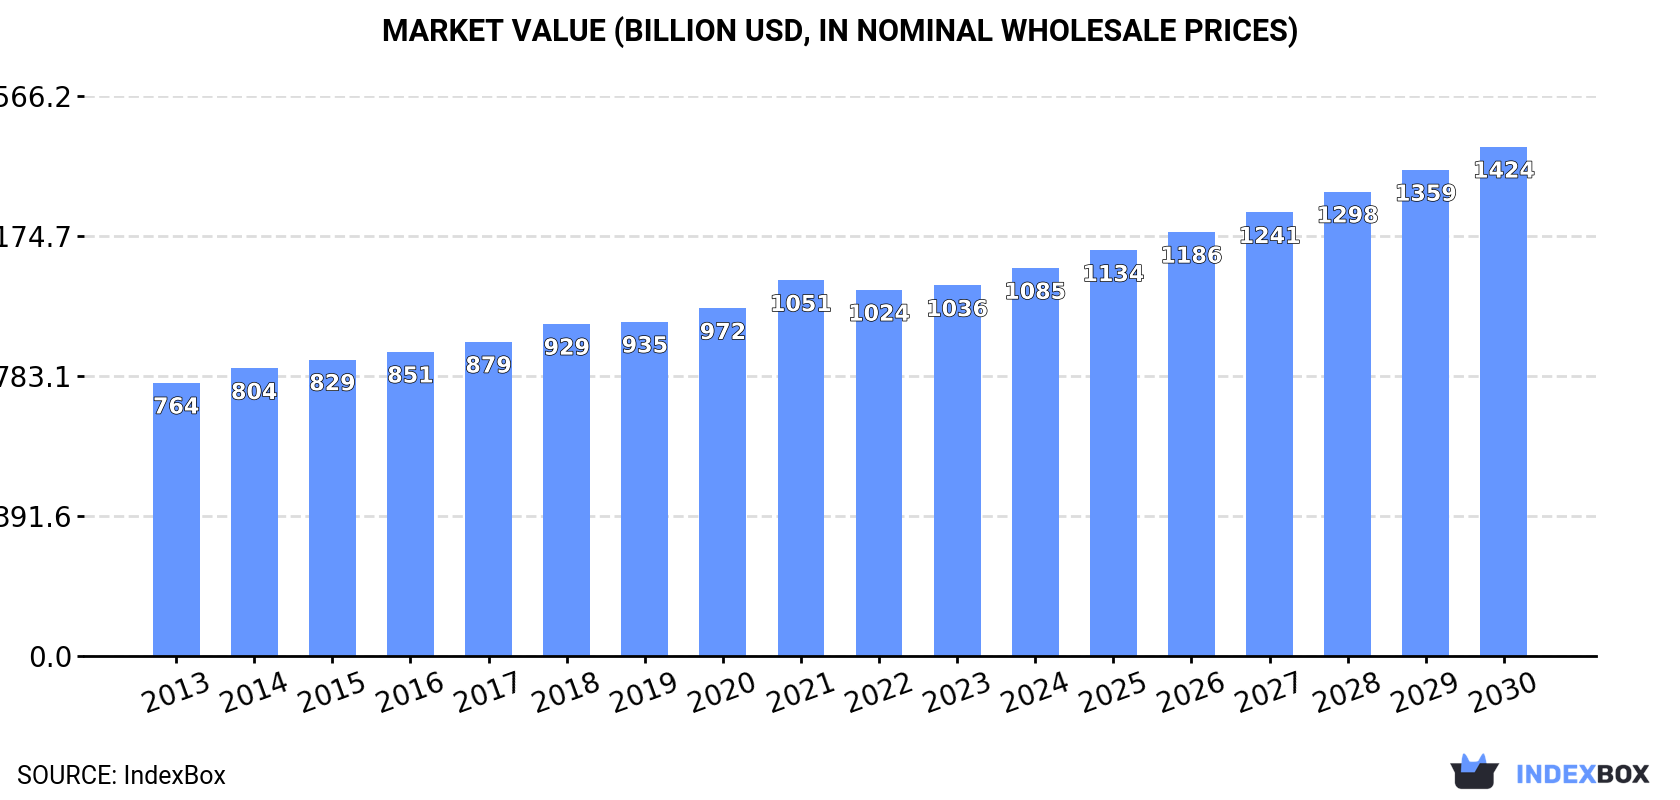
In value terms, the market is forecast to increase with an anticipated CAGR of +4.6% for the period from 2023 to 2030, which is projected to bring the market value to $1,423.9B (in nominal wholesale prices) by the end of 2030.
Consumption
World Consumption of Animal And Pet Feed
In 2023, approx. 1,017M tons of animal and pet feed were consumed worldwide; remaining relatively unchanged against the previous year's figure. The total consumption volume increased at an average annual rate of +2.5% from 2013 to 2023; the trend pattern remained relatively stable, with somewhat noticeable fluctuations being recorded in certain years. Global consumption peaked at 1,028M tons in 2021; however, from 2022 to 2023, consumption remained at a lower figure.
The global animal feed market value totaled $1,036.4B in 2023, flattening at the previous year. This figure reflects the total revenues of producers and importers (excluding logistics costs, retail marketing costs, and retailers' margins, which will be included in the final consumer price). The market value increased at an average annual rate of +3.1% over the period from 2013 to 2023; the trend pattern indicated some noticeable fluctuations being recorded in certain years. The growth pace was the most rapid in 2021 with an increase of 8%. As a result, consumption reached the peak level of $1,050.6B. From 2022 to 2023, the growth of the global market remained at a lower figure.
Consumption By Country
The country with the largest volume of animal feed consumption was China (151M tons), comprising approx. 15% of total volume. Moreover, animal feed consumption in China exceeded the figures recorded by the second-largest consumer, India (56M tons), threefold. Russia (41M tons) ranked third in terms of total consumption with a 4% share.
In China, animal feed consumption increased at an average annual rate of +3.5% over the period from 2013-2023. The remaining consuming countries recorded the following average annual rates of consumption growth: India (+2.1% per year) and Russia (+6.2% per year).
In value terms, China ($164.5B), India ($91.6B) and Japan ($86.3B) constituted the countries with the highest levels of market value in 2023, together accounting for 33% of the global market. Bangladesh, Russia, Brazil, the United States, Mexico, Nigeria, Indonesia, Spain, Germany and Pakistan lagged somewhat behind, together comprising a further 23%.
Russia, with a CAGR of +5.9%, recorded the highest growth rate of market size among the main consuming countries over the period under review, while market for the other global leaders experienced more modest paces of growth.
In 2023, the highest levels of animal feed per capita consumption was registered in Spain (623 kg per person), followed by Russia (283 kg per person), Germany (255 kg per person) and Japan (211 kg per person), while the world average per capita consumption of animal feed was estimated at 128 kg per person.
From 2013 to 2023, the average annual growth rate of the animal feed per capita consumption in Spain amounted to +3.3%. In the other countries, the average annual rates were as follows: Russia (+6.2% per year) and Germany (+0.6% per year).
Production
World Production of Animal And Pet Feed
In 2023, approx. 1,017M tons of animal and pet feed were produced worldwide; flattening at the year before. The total output volume increased at an average annual rate of +2.5% over the period from 2013 to 2023; the trend pattern remained consistent, with only minor fluctuations being observed in certain years. The pace of growth was the most pronounced in 2020 with an increase of 11% against the previous year. Over the period under review, global production attained the maximum volume at 1,027M tons in 2021; however, from 2022 to 2023, production failed to regain momentum.
In value terms, animal feed production expanded slightly to $1,042.7B in 2023 estimated in export price. The total output value increased at an average annual rate of +3.2% over the period from 2013 to 2023; the trend pattern indicated some noticeable fluctuations being recorded in certain years. The growth pace was the most rapid in 2021 with an increase of 11% against the previous year. As a result, production reached the peak level of $1,067.4B. From 2022 to 2023, global production growth remained at a somewhat lower figure.
Production By Country
China (152M tons) constituted the country with the largest volume of animal feed production, comprising approx. 15% of total volume. Moreover, animal feed production in China exceeded the figures recorded by the second-largest producer, India (56M tons), threefold. The third position in this ranking was taken by Russia (41M tons), with a 4% share.
From 2013 to 2023, the average annual growth rate of volume in China totaled +3.4%. The remaining producing countries recorded the following average annual rates of production growth: India (+2.1% per year) and Russia (+6.4% per year).
Imports
World Imports of Animal And Pet Feed
In 2023, after three years of growth, there was decline in purchases abroad of animal and pet feed, when their volume decreased by -2.6% to 20M tons. The total import volume increased at an average annual rate of +1.5% over the period from 2013 to 2023; the trend pattern remained consistent, with somewhat noticeable fluctuations being recorded in certain years. The growth pace was the most rapid in 2020 when imports increased by 7.4% against the previous year. Global imports peaked at 20M tons in 2022, and then contracted modestly in the following year.
In value terms, animal feed imports shrank to $21.2B in 2023. Over the period under review, total imports indicated a perceptible expansion from 2013 to 2023: its value increased at an average annual rate of +3.7% over the last decade. The trend pattern, however, indicated some noticeable fluctuations being recorded throughout the analyzed period. Based on 2023 figures, imports increased by +53.1% against 2016 indices. The growth pace was the most rapid in 2021 when imports increased by 12%. Over the period under review, global imports reached the maximum at $22.3B in 2022, and then contracted in the following year.
Imports By Country
The purchases of the twelve major importers of animal and pet feed, namely the Netherlands, Belgium, Germany, South Korea, France, Ireland, Vietnam, the United States, Norway, Poland, the UK and Italy, represented more than third of total import. Iraq (359K tons) followed a long way behind the leaders.
From 2013 to 2023, the biggest increases were recorded for Norway (with a CAGR of +20.5%), while purchases for the other global leaders experienced more modest paces of growth.
In value terms, the Netherlands ($1B), Belgium ($1B) and Germany ($972M) constituted the countries with the highest levels of imports in 2023, together accounting for 14% of global imports. The United States, France, Norway, Vietnam, the UK, Italy, Poland, South Korea, Ireland and Iraq lagged somewhat behind, together comprising a further 26%.
Among the main importing countries, Norway, with a CAGR of +17.7%, recorded the highest rates of growth with regard to the value of imports, over the period under review, while purchases for the other global leaders experienced more modest paces of growth.
Import Prices By Country
In 2023, the average animal feed import price amounted to $1,086 per ton, with a decrease of -2.5% against the previous year. Over the last decade, it increased at an average annual rate of +2.1%. The most prominent rate of growth was recorded in 2021 when the average import price increased by 9.9% against the previous year. Over the period under review, average import prices attained the maximum at $1,114 per ton in 2022, and then shrank modestly in the following year.
There were significant differences in the average prices amongst the major importing countries. In 2023, amid the top importers, the country with the highest price was the United States ($1,703 per ton), while South Korea ($513 per ton) was amongst the lowest.
From 2013 to 2023, the most notable rate of growth in terms of prices was attained by the UK (+6.0%), while the other global leaders experienced more modest paces of growth.
Exports
World Exports of Animal And Pet Feed
In 2023, after eight years of growth, there was decline in overseas shipments of animal and pet feed, when their volume decreased by -3.6% to 19M tons. The total export volume increased at an average annual rate of +1.2% from 2013 to 2023; the trend pattern remained relatively stable, with somewhat noticeable fluctuations being observed throughout the analyzed period. The most prominent rate of growth was recorded in 2017 with an increase of 5.4%. The global exports peaked at 20M tons in 2022, and then declined slightly in the following year.
In value terms, animal feed exports dropped modestly to $21.5B in 2023. Over the period under review, total exports indicated a measured expansion from 2013 to 2023: its value increased at an average annual rate of +3.9% over the last decade. The trend pattern, however, indicated some noticeable fluctuations being recorded throughout the analyzed period. Based on 2023 figures, exports increased by +62.4% against 2015 indices. The pace of growth appeared the most rapid in 2021 when exports increased by 16% against the previous year. Over the period under review, the global exports attained the peak figure at $21.6B in 2022, and then dropped slightly in the following year.
Exports By Country
In 2023, the Netherlands (3.3M tons), followed by Germany (2.1M tons), Belgium (1.6M tons), China (1.3M tons) and the United States (1.3M tons) were the major exporters of animal and pet feed, together comprising 50% of total exports. The following exporters - France (809K tons), Turkey (539K tons), the UK (487K tons), Spain (428K tons), Austria (373K tons), Italy (372K tons), Malaysia (349K tons) and Russia (341K tons) - together made up 19% of total exports.
From 2013 to 2023, the most notable rate of growth in terms of shipments, amongst the leading exporting countries, was attained by Russia (with a CAGR of +21.7%), while the other global leaders experienced more modest paces of growth.
In value terms, the largest animal feed supplying countries worldwide were the Netherlands ($3B), the United States ($2.2B) and Germany ($1.8B), with a combined 33% share of global exports. Belgium, China, France, the UK, Spain, Italy, Austria, Turkey, Malaysia and Russia lagged somewhat behind, together accounting for a further 37%.
Russia, with a CAGR of +18.1%, saw the highest growth rate of the value of exports, in terms of the main exporting countries over the period under review, while shipments for the other global leaders experienced more modest paces of growth.
Export Prices By Country
The average animal feed export price stood at $1,109 per ton in 2023, with an increase of 2.9% against the previous year. Over the period from 2013 to 2023, it increased at an average annual rate of +2.6%. The growth pace was the most rapid in 2021 an increase of 13%. Over the period under review, the average export prices reached the peak figure in 2023 and is expected to retain growth in the near future.
There were significant differences in the average prices amongst the major exporting countries. In 2023, amid the top suppliers, the country with the highest price was the United States ($1,729 per ton), while Turkey ($646 per ton) was amongst the lowest.
From 2013 to 2023, the most notable rate of growth in terms of prices was attained by the United States (+4.1%), while the other global leaders experienced more modest paces of growth.
This report provides an in-depth analysis of the global animal feed market. Within it, you will discover the latest data on market trends and opportunities by country, consumption, production and price developments, as well as the global trade (imports and exports). The forecast exhibits the market prospects through 2030.
Product coverage:
- Prodcom 10911010 - Premixtures for farm animal feeds
- Prodcom 10911033 - Preparations used for farm animal feeding (excluding premixtures): pigs
- Prodcom 10911035 - Preparations used for farm animal feeding (excluding premixtures): cattle
- Prodcom 10911037 - Preparations used for farm animal feeding (excluding premixtures): poultry
- Prodcom 10921060 - Preparations used for feeding pets (excluding preparations for cats or dogs, p.r.s.)
Country coverage:
Worldwide - the report contains statistical data for 200 countries and includes detailed profiles of the 50 largest consuming countries:
- USA
- China
- Japan
- Germany
- United Kingdom
- France
- Brazil
- Italy
- Russian Federation
- India
- Canada
- Australia
- Republic of Korea
- Spain
- Mexico
- Indonesia
- Netherlands
- Turkey
- Saudi Arabia
- Switzerland
- Sweden
- Nigeria
- Poland
- Belgium
- Argentina
- Norway
- Austria
- Thailand
- United Arab Emirates
- Colombia
- Denmark
- South Africa
- Malaysia
- Israel
- Singapore
- Egypt
- Philippines
- Finland
- Chile
- Ireland
- Pakistan
- Greece
- Portugal
- Kazakhstan
- Algeria
- Czech Republic
- Qatar
- Peru
- Romania
- Vietnam
+ the largest producing countries
Data coverage:
- Global market volume and value
- Per Capita consumption
- Forecast of the market dynamics in the medium term
- Global production, split by region and country
- Global trade (exports and imports)
- Export and import prices
- Market trends, drivers and restraints
- Key market players and their profiles
Reasons to buy this report:
- Take advantage of the latest data
- Find deeper insights into current market developments
- Discover vital success factors affecting the market
This report is designed for manufacturers, distributors, importers, and wholesalers, as well as for investors, consultants and advisors.
In this report, you can find information that helps you to make informed decisions on the following issues:
- How to diversify your business and benefit from new market opportunities
- How to load your idle production capacity
- How to boost your sales on overseas markets
- How to increase your profit margins
- How to make your supply chain more sustainable
- How to reduce your production and supply chain costs
- How to outsource production to other countries
- How to prepare your business for global expansion
While doing this research, we combine the accumulated expertise of our analysts and the capabilities of artificial intelligence. The AI-based platform, developed by our data scientists, constitutes the key working tool for business analysts, empowering them to discover deep insights and ideas from the marketing data.
-
1. INTRODUCTION
Making Data-Driven Decisions to Grow Your Business
- REPORT DESCRIPTION
- RESEARCH METHODOLOGY AND AI PLATFORM
- DATA-DRIVEN DECISIONS FOR YOUR BUSINESS
- GLOSSARY AND SPECIFIC TERMS
-
2. EXECUTIVE SUMMARY
A Quick Overview of Market Performance
- KEY FINDINGS
- MARKET TRENDS This Chapter is Available Only for the Professional Edition PRO
-
3. MARKET OVERVIEW
Understanding the Current State of The Market and Its Prospects
- MARKET SIZE
- CONSUMPTION BY COUNTRY
- MARKET FORECAST TO 2030
-
4. MOST PROMISING PRODUCT
Finding New Products to Diversify Your Business
This Chapter is Available Only for the Professional Edition PRO- TOP PRODUCTS TO DIVERSIFY YOUR BUSINESS
- BEST-SELLING PRODUCTS
- MOST CONSUMED PRODUCT
- MOST TRADED PRODUCT
- MOST PROFITABLE PRODUCT FOR EXPORT
-
5. MOST PROMISING SUPPLYING COUNTRIES
Choosing the Best Countries to Establish Your Sustainable Supply Chain
This Chapter is Available Only for the Professional Edition PRO- TOP COUNTRIES TO SOURCE YOUR PRODUCT
- TOP PRODUCING COUNTRIES
- TOP EXPORTING COUNTRIES
- LOW-COST EXPORTING COUNTRIES
-
6. MOST PROMISING OVERSEAS MARKETS
Choosing the Best Countries to Boost Your Exports
This Chapter is Available Only for the Professional Edition PRO- TOP OVERSEAS MARKETS FOR EXPORTING YOUR PRODUCT
- TOP CONSUMING MARKETS
- UNSATURATED MARKETS
- TOP IMPORTING MARKETS
- MOST PROFITABLE MARKETS
7. GLOBAL PRODUCTION
The Latest Trends and Insights into The Industry
- PRODUCTION VOLUME AND VALUE
- PRODUCTION BY COUNTRY
8. GLOBAL IMPORTS
The Largest Importers on The Market and How They Succeed
- IMPORTS FROM 2012–2023
- IMPORTS BY COUNTRY
- IMPORT PRICES BY COUNTRY
9. GLOBAL EXPORTS
The Largest Exporters on The Market and How They Succeed
- EXPORTS FROM 2012–2023
- EXPORTS BY COUNTRY
- EXPORT PRICES BY COUNTRY
-
10. PROFILES OF MAJOR PRODUCERS
The Largest Producers on The Market and Their Profiles
This Chapter is Available Only for the Professional Edition PRO -
11. COUNTRY PROFILES
The Largest Markets And Their Profiles
This Chapter is Available Only for the Professional Edition PRO- United States
- China
- Japan
- Germany
- United Kingdom
- France
- Brazil
- Italy
- Russian Federation
- India
- Canada
- Australia
- Republic of Korea
- Spain
- Mexico
- Indonesia
- Netherlands
- Turkey
- Saudi Arabia
- Switzerland
- Sweden
- Nigeria
- Poland
- Belgium
- Argentina
- Norway
- Austria
- Thailand
- United Arab Emirates
- Colombia
- Denmark
- South Africa
- Malaysia
- Israel
- Singapore
- Egypt
- Philippines
- Finland
- Chile
- Ireland
- Pakistan
- Greece
- Portugal
- Kazakhstan
- Algeria
- Czech Republic
- Qatar
- Peru
- Romania
- Vietnam
-
LIST OF TABLES
- Key Findings In 2023
- Market Volume, In Physical Terms, 2012–2023
- Market Value, 2012–2023
- Per Capita Consumption, By Country, 2018–2023
- Production, In Physical Terms, By Country, 2012–2023
- Imports, In Physical Terms, By Country, 2012–2023
- Imports, In Value Terms, By Country, 2012–2023
- Import Prices, By Country Of Destination, 2012–2023
- Exports, In Physical Terms, By Country, 2012–2023
- Exports, In Value Terms, By Country, 2012–2023
- Export Prices, By Country Of Origin, 2012–2023
-
LIST OF FIGURES
- Market Volume, In Physical Terms, 2012–2023
- Market Value, 2012–2023
- Consumption, By Country, 2023
- Market Volume Forecast to 2030
- Market Value Forecast to 2030
- Products: Market Size And Growth, By Type
- Products: Average Per Capita Consumption, By Type
- Products: Exports And Growth, By Type
- Products: Export Prices And Growth, By Type
- Production Volume And Growth
- Exports And Growth
- Export Prices And Growth
- Market Size And Growth
- Per Capita Consumption
- Imports And Growth
- Import Prices
- Production, In Physical Terms, 2012–2023
- Production, In Value Terms, 2012–2023
- Production, By Country, 2023
- Production, In Physical Terms, By Country, 2012–2023
- Imports, In Physical Terms, 2012–2023
- Imports, In Value Terms, 2012–2023
- Imports, In Physical Terms, By Country, 2023
- Imports, In Physical Terms, By Country, 2012–2023
- Imports, In Value Terms, By Country, 2012–2023
- Import Prices, By Country, 2012–2023
- Exports, In Physical Terms, 2012–2023
- Exports, In Value Terms, 2012–2023
- Exports, In Physical Terms, By Country, 2023
- Exports, In Physical Terms, By Country, 2012–2023
- Exports, In Value Terms, By Country, 2012–2023
- Export Prices, 2012–2023


